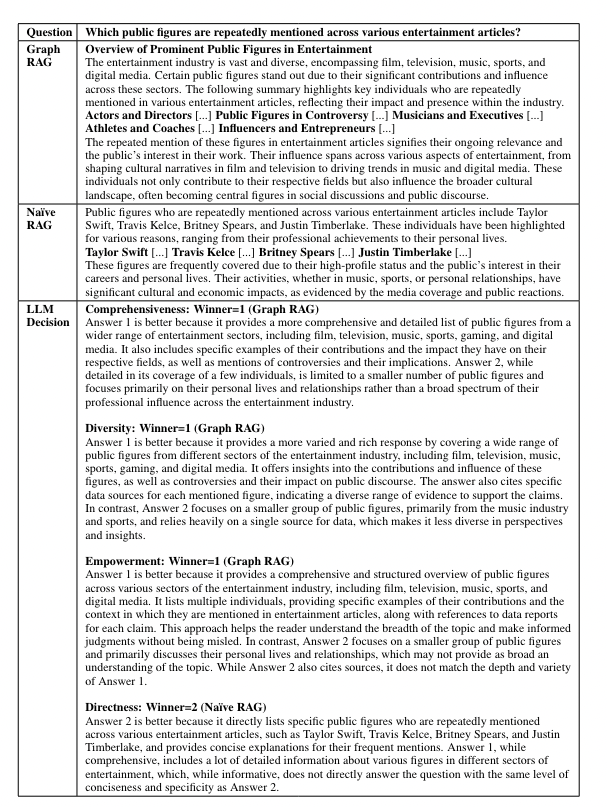
Retrieval-augmented generation (RAG) allows large language models (LLMs) to answer questions using external knowledge sources. Still, it needs help with global questions about entire text corpora, such as identifying main themes. Microsoft's recent research proposed Graph RAG in April, which combines RAG and Query Focussed Summarization or QFS methods for scalable question answering over private text corpora. Graph RAG uses an LLM to create a graph-based text index, deriving an entity knowledge graph and generating community summaries of related entities. When a question is asked, these summaries generate partial responses that are combined into a final answer. Graph RAG significantly improves the comprehensiveness and diversity of answers for global questions over large datasets compared to a basic RAG approach.
Limitations of Retrieval-Augmented Generation (RAG)
RAG Limitations: RAG is effective for answering questions when the answers are found within specific, retrievable text regions. However, it needs help with more general questions that require summarizing information from an entire dataset.
QFS Relevance: Query-focused summarization (QFS) is more suitable for these general questions because it generates natural language summaries based on the query rather than just extracting text excerpts.
Advancements in LLMs: Modern large language models (LLMs) like GPT, Llama, and Gemini have improved all types of summarization tasks, making distinctions between different kinds of summarization (abstractive vs. extractive, single-document vs. multi-document) less significant.
Challenges with Large Corpora: Despite these advancements, summarizing entire corpora remains challenging because the text volume often exceeds the context window of LLMs, leading to potential loss of information.
Potential Solutions: A new form of pre-indexing could enhance RAG approaches, specifically for global summarization tasks, by better organizing and summarizing large datasets.
Graph RAG is a novel approach that uses global summarization of a knowledge graph created by an LLM. Unlike previous methods focusing on structured graph retrieval, this approach leverages the graph’s modularity to divide it into closely related groups or communities.
Here’s how it works:
- Community Summaries: The LLM generates summaries for these communities, providing a complete overview of the graph and the documents it covers.
- Query Answering: A map-reduce method is used to answer queries. First, each community summary is used to create partial answers independently. Then, these partial answers are combined to form a final, comprehensive response.
To test this approach, diverse real-world datasets, including podcast transcripts and news articles, are used to see how well it handles questions about broad themes and issues. Additionally, Graph RAG approaches are compared to traditional RAG methods, and it was found that the Graph RAG approach provides more comprehensive and diverse answers at lower costs, especially when using summaries from intermediate and lower levels of the community hierarchy.
Introduction to Graph RAG
Graph RAG is a concept based on a knowledge graph, which combines with a large language model to provide intelligent, cost-effective, and more accurate search results.
Graph RAG aims to overcome the limitations of traditional RAG methods by leveraging graph structures for better organization and summarization of information, especially when dealing with extensive and complex datasets.
Graph RAG combines graph technology with retrieval-augmented generation to enhance how large language models (LLMs) process and understand complex information. Here's a breakdown:
- Graph Database: It organizes information as a network of interconnected nodes (entities) and edges (relationships). This structure is ideal for representing complex contexts and relationships in a graphical format.
- Knowledge Graph: By building a knowledge graph, you provide a rich, structured context that helps LLMs better understand how different entities relate and interact. This improves the LLM's ability to express and reason about the information.
- Graph RAG Concept:
- Knowledge Graph as Vocabulary: In Graph RAG, the knowledge graph is treated like a vast vocabulary where entities and relationships are akin to words.
- Modeling Entities and Relationships: It jointly models entities and relationships during retrieval. This means it can more accurately grasp the intent behind a query and deliver more precise results.
Graph RAG leverages the structured, interconnected nature of knowledge graphs to enhance LLMs' retrieval and generation capabilities, leading to better understanding and responses to complex queries.
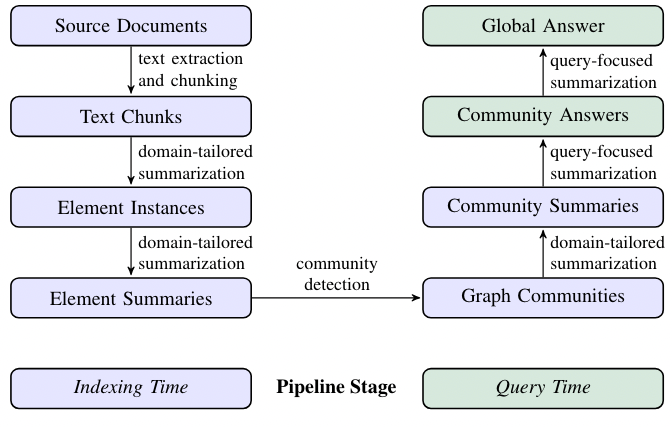
Source Documents → Text Chunks
When processing text from source documents, a key decision is how to split the text into chunks. Each chunk is then used with LLM prompts to build a graph index. Longer chunks mean fewer LLM calls but can reduce recall due to the limitations of long context windows in LLMs. Therefore, finding a balance between recall and precision is important to get the best results.
Text Chunks → Element Instances
This step involves extracting graph nodes and edges from text chunks using a multipart LLM prompt. The prompt first identifies entities, including their names, types, and descriptions, and then identifies relationships between them, detailing the source and target entities and their connections. This information is output as a list of delimited tuples. To create the prompt for specific domains, we use few-shot examples relevant to the domain, such as science or law, enhancing extraction accuracy. Additionally, a secondary prompt extracts covariates like claims related to the entities, including details like subject, object, and dates. To ensure comprehensive extraction, we use multiple rounds of "gleanings," where the LLM assesses if any entities were missed and then tries to detect these missed entities in subsequent rounds. This approach helps maintain high quality even with larger chunk sizes, avoiding quality loss or unnecessary noise.
Element Instances → Element Summaries
In this step, an LLM is used to create summaries of entities, relationships, and claims from text, a form of abstractive summarization. The LLM generates meaningful descriptions of concepts. Next, these individual descriptions are further summarized into cohesive blocks of text for each graph element (entity, relationship, claim). There may be inconsistent references to the same entity, leading to duplicates. Still, this is manageable since the LLM can understand different names for the same entity, and our approach groups related entities together. This method ensures rich, descriptive summaries that support global, query-focused summarization, distinguishing our approach from traditional knowledge graphs that use concise, fixed-format triples.
Element Summaries → Graph Communities
In this step, the index from the previous stage is turned into an undirected, weighted graph where nodes represent entities and edges represent relationships between them, with weights showing the strength of these relationships. To make sense of this graph, we use the Leiden algorithm, which efficiently finds communities or groups of nodes that are closely connected. This algorithm helps to break down the graph into hierarchical layers, each showing different levels of community structure. This hierarchical partitioning effectively summarizes the entire graph by focusing on smaller, manageable groups of related nodes.
Graph Communities → Community Summaries
This step creates a detailed summary of each community in the Leiden hierarchy. These summaries help understand the overall structure and meaning of the dataset, even without a specific question. For instance, a user can read through summaries at a broader level to find general themes and then dive into more detailed summaries at lower levels for specific topics. In this case, these community summaries are handy for answering broad, global queries by providing well-organized and meaningful information from the graph.
Community Summaries → Community Answers → Global Answer
Given a user query, the community summaries generated in the previous step can be used to create a final answer in a multi-stage process.
Here’s how the community summaries are used to answer a user query:
- Prepare Summaries: First, shuffle and split the community summaries into manageable chunks. This helps spread important information so it’s not all in one place.
- Generate Answers: For each chunk, partial answers are created using an LLM, which also rates how helpful each answer is for the query. Low-scored answers are discarded.
- Combine Answers: The answers are sorted by their score; they are added together into a single context window, and then this combined context is used to generate the final answer for the user.
This method helps ensures a thorough and relevant response to the query.
What is a Knowledge Graph?
A knowledge graph typically consists of nodes, edges, and labels. An edge represents the relationship between the nodes.
- Nodes: These represent entities, which can be anything of interest, such as people, places, organizations, concepts, or objects.
- Edges: These are the connections between nodes, representing relationships or interactions between the entities. For example, an edge might show that a person "works for" a company or that a product "belongs to" a category.
- Labels: Labels represent the type of relationship.
A knowledge graph can be called a structured database that represents information in an interconnected way. The overall structure is a network where entities are connected, allowing for complex relationships and data to be expressed to highlight how different pieces of information are related.
A Paperspace Demo
Bring this project to life
In this space, we will explore how to run Graph RAG Local with Ollama using an interactive Gradio application. Microsoft's Graph RAG version has been adapted to support local models with Ollama integration. Additionally, please note Ollama handles both LLMs and embeddings. This project also includes a new interactive user interface. Furthermore, this project is very recent and evolving rapidly.
Before we jump to the installation steps, let us quickly go through a few of this project's notable features.
- Local Model Support: Supports local models such as llama3 and mistral with Ollama for LLM and embeddings.
- Interactive UI: User-friendly interface for managing data, running queries, and visualizing results. Additionally, it even provides a graph visualization option
- Cost-Effective: Eliminate dependency on costly OpenAI models.
- File Management: Upload, view, edit, and delete input files directly from the UI. However, while trying it out, I faced issues while uploading text files.
- Settings Management: Easily update Graph RAG settings through the Gradio UI.
- Output Exploration: Browse and view indexing outputs and artifacts.
Before starting with the installations, we highly recommend that you create a separate environment. Otherwise, you may come across dependency issues.
You can log in to the Paperspace console and open up a new terminal.
- Create and activate the environment.
python -m venv tutorial-env
source tutorial-env/bin/activate
- Install Ollama and pull the mistral model along with the embedding model; in our case, we will pull 'mxbai-embed-large' as our embedding model.
ollama pull mxbai-embed-largeWe have a detailed blog post on installing Ollama and pull model. We highly recommend that our readers click the link and check out the blog.
Once everything is installed, we will move to the next step.
- Git clone the repository and install the requirements.txt
git clone https://github.com/severian42/GraphRAG-Local-UI.git && cd GraphRAG-Local-UIpip install -r requirements.txt- Run the code below to start the live Gradio app.
python app.pyAnd there you go! The UI of Graph RAG is live.
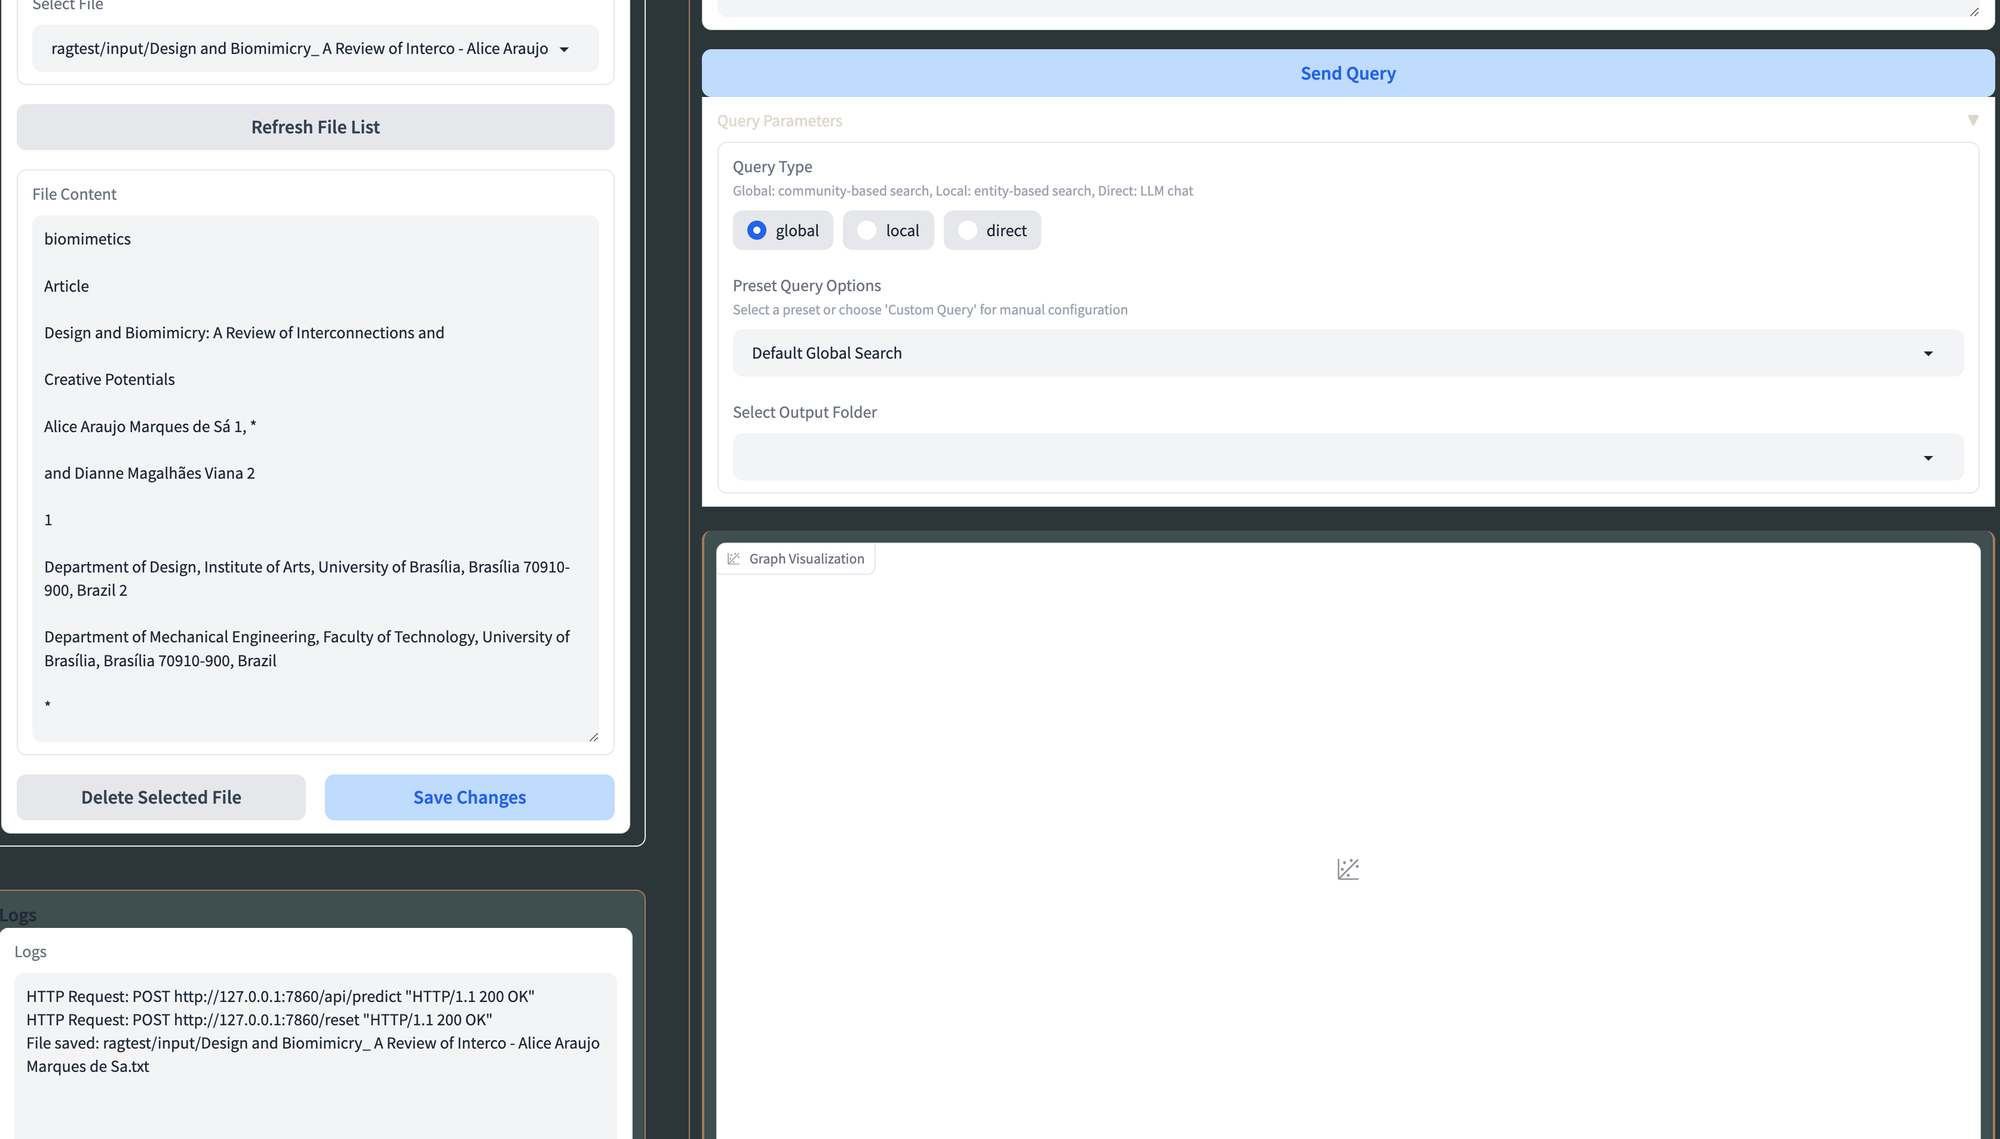
In data management, you can either click on this option or navigate to file operations, where you can upload your text file or select an existing one.
In Data Management, you can upload .txt files to the input directory via the "File Upload" section in the "Data Management" tab. You can view, edit, and delete these files in the "File Management" section, and refresh the list of available files with the "Refresh File List" button. To configure indexing, go to the "Indexing" tab, set the root directory (default is "./ragtest"), and optionally upload a config file.
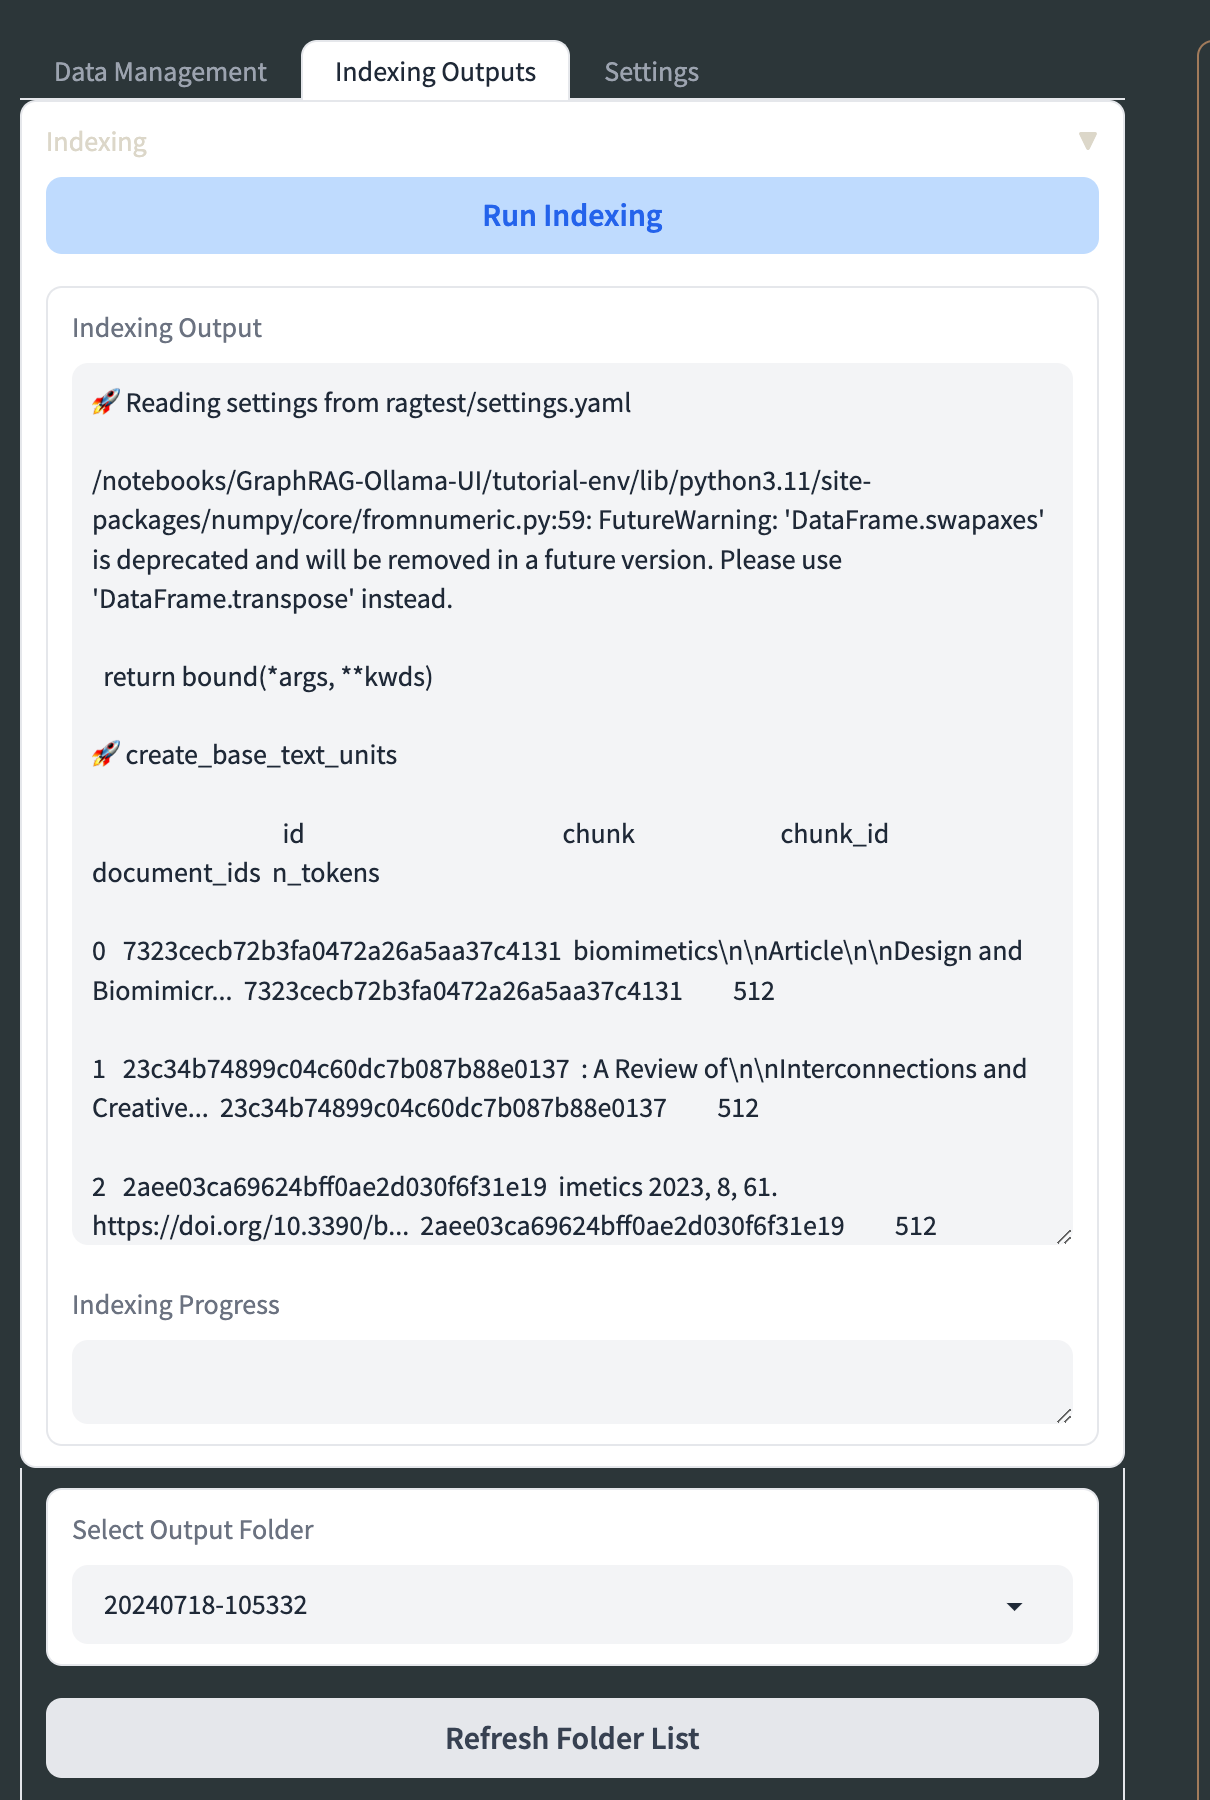
Adjust parameters like verbosity, caching, and output formats before clicking "Run Indexing" to start the process, with real-time progress monitoring available. If needed, you can halt the process using "Stop Indexing." In the "KG Chat/Outputs" section, you can explore indexed data by selecting an output folder, viewing file contents, and generating visualizations of your knowledge graph from Graph ML files. Customize these visualizations using the "Visualization Settings" accordion.
For LLM settings, configure API base URLs and keys for both LLM and embeddings, choose the service type, select models, and adjust parameters such as system message, context window, temperature, and max tokens. Save these changes by clicking "Update LLM Settings." When querying, select the query type (global, local, or direct chat), choose a preset option or customize query parameters, enter your query, and view results in the chat interface. Additional Graph RAG settings can be adjusted in the "YAML Settings" tab as needed.
For Ollama: Use models like llama2, mistral, phi-2, etc. Find the complete list of Ollama models here.
gradio app.py, try running pip install --upgrade gradio and then exit out and start a new terminal.How to Effortlessly Rent GPUs on Paperspace
Paperspace is highly efficient in providing GPU resources, offering a scalable solution for both individual and enterprise needs. The platform delivers powerful GPUs on-demand, which can be easily rented and managed through the platform. Paperspace supports a range of GPU types and configurations, from entry-level options for light tasks to high-end GPUs such as H100 for intensive computations. This flexibility allows users to select the appropriate resources based on their specific workload requirements.
Additionally, Paperspace's infrastructure ensures high availability and performance, with global data centers. Automated scaling and pay-as-you-go pricing models further enhance efficiency, allowing users to optimize costs by paying only for the resources they use.
In order to use Paperspace GPUs, start by creating an account or logging into your existing Paperspace account on their website.
Once you are logged in to the workspace. Click on "Create Project," this will open up the Project page. Next, click the "Create" tab to create a project.
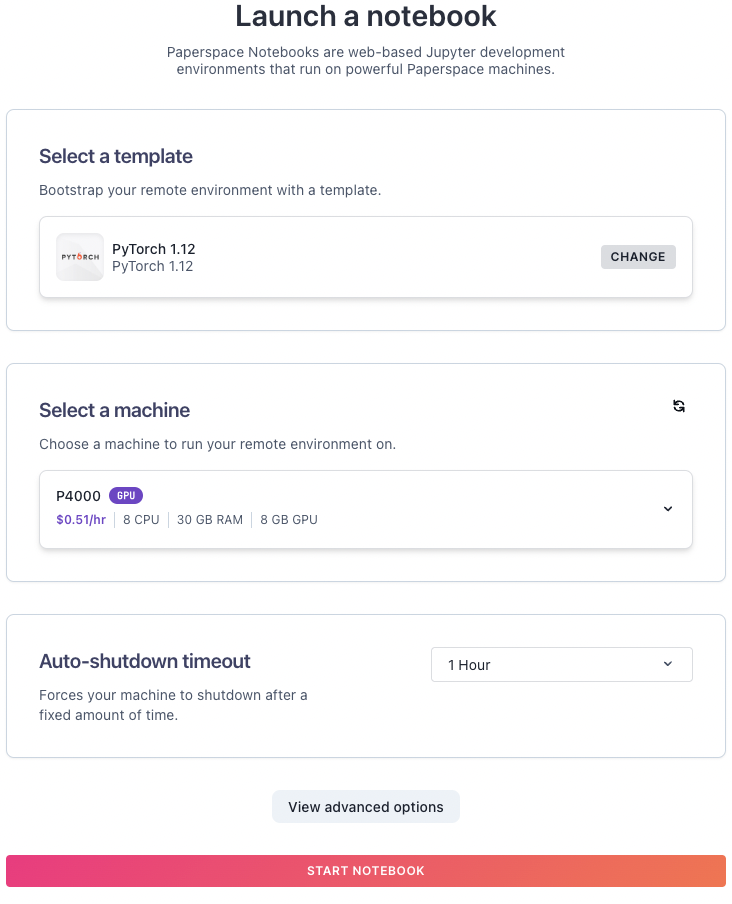
Now, from here we can launch a notebook using the machine of your choice. Select a machine. Browse through the available GPU plans and select the one that best fits your needs. Paperspace offers various options based on performance and pricing.
Make sure to check and adjust the Auto-shutdown timeout to your desirable time. Once done click on start notebook. And there you go!
Enjoy flexible billing with Paperspace’s pay-as-you-go pricing model, ensuring you pay for the GPU resources you actually use.
This streamlined process allows you to efficiently rent and manage GPUs, focusing on your projects without the hassle of complex configurations or long setup times.
Conclusion
Graph RAG is a powerful concept that combines knowledge graph creation, retrieval-augmented generation (RAG), and query-focused summarization (QFS) to enhance understanding of large text corpora. The research results shows that it significantly outperforms basic RAG methods in answer quality and is competitive with global approaches like map-reduce summarization, but at a lower token cost. For datasets with frequent global queries, using summaries from top-level communities in the graph index offers a superior and cost-effective solution compared to naïve RAG.
This research on Graph RAG has focused on specific sensemaking questions for datasets around 1 million tokens. Further research is needed to assess how performance varies with different question types, data formats, and dataset sizes, and to validate our metrics with end users. While Graph RAG consistently outperforms other methods, simpler graph-free summarization approaches are also competitive. Decisions about using a graph index should consider factors such as compute costs, query frequency, and the added value of the graph's community summaries.
Future work could refine Graph RAG by integrating more local RAG methods, embedding-based query matching, and hybrid approaches that combine these with community summaries. Exploring these methods across various levels of the community hierarchy could also provide deeper insights and better information retrieval.
We hope you enjoyed reading the article!