

Angle-based Outlier Detection (ABOD) is one of the popular techniques for detecting anomalies or outliers in a given dataset and is often used in practice when working in a multi-variate setting. It is part of the Geometric methods cadre for detecting outliers. Other methods in this include Depth-based techniques that develop on the concept of convex hulls. For this blog, we will only focus on ABOD, its theory and a short tutorial on implementing it using the PyOD python package. But before that, let's define an outlier. Any observation or data point that holds properties that are quite different from the majority of observations in the dataset is called an outlier/anomaly. Outliers in the dataset can occur because of many factors such as the instrument recording error, human error, natural variation from the majority population, etc.
You might want to detect anomalies in the dataset when working on use-cases like fraud transaction detection in the banking domain, sales peak-dip analysis in the e-commerce space, identifying a malicious node/packet in the network, etc. Apart from use cases that do not necessarily demand detecting outliers as an end goal, you might want to consider handling such data points in the dataset when trying to fit the model that learns the general pattern possessed by the majority of the data points. Often the decision of removal of an outlier depends on the developer by taking into consideration things like - if the potential outlier is a natural part of the population or if it's derived because of some instrumental error and so on. Anomalies in the data can result in learning skewed data representation, providing a misleading representation of the underlying data. Hence it becomes necessary in dealing with such points for better fitment of machine learning models by adhering to their assumptions.
Also, depending on the sensitivity of the domain where these systems are deployed, it's often a good practice to be conservative and have high False Positives (FP) compared to False Negatives (FN). And that's mostly because you can always supervise the final decision in the real world by adding a human in the loop. Although, this might increase the overall turn-around time and lead to few interrogations. But that's still far better than skipping an anomaly and regret later. For example - It's better to be conservative and stop any unusual high payment going out or coming into a bank account and then resolve it by confirming the same over an IVR or a Normal call with the customer, rather than getting scammed.
False Positives - Model says it’s an outlier. But it’s not an outlier.
False Negatives - Model says it’s not an outlier. But it’s an outlier.
So let's now delve into understanding ABOD and it's variations in-detail -
Angle-based Outlier Detection (ABOD)
This technique is based on the idea of keeping an eye on the angle formed by a set of any three data points in the multi-variate feature space. The variance in the magnitude of the angular enclosure comes out to be different for outliers and the normal points. Usually the observed variance is higher for the inlier points than for outliers, hence such a measure helps us to cluster normal and outlier points differently. The angle-based outlier (ABOD) technique works pretty well in high-dimensional space, unlike other distance-based measures that suffer from the “Curse of dimensionality”. The distance between any two points in the high dimension space is almost similar. In such scenarios, angles can give better picture of closeness.
The algorithm is pretty straightforward and is described below -
- Iterate over each data point and calculate the angle it(pivot) forms with all other data pairs and store them in the angle list.
- Calculate the variance of this angle list created as part of Step-1.
- Variance values less than a certain threshold can be marked as potential anomalies. (Low variance means pivot point is an anomaly, High variance means pivot point is a normal point)
Let's understand this visually as well -
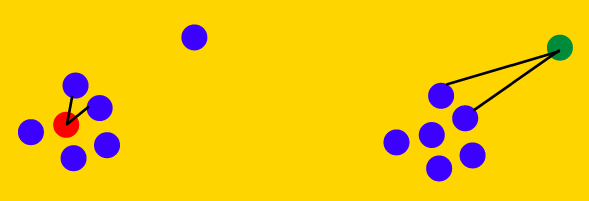
As can be seen in the left figure above, visually we see 2 clusters, one for normal points and another for an outlier, the single blue point. If we choose the red point as the point of interest (pivot), and we want to see if this point is an outlier or not; we would calculate the angle enclosed by this point and any other two points in the space. On iterating over all the pairs and calculating the angle enclosed with this pivot, we are likely to observe a lot of variance in the angles. Such a pattern shows that the pivot point is a part of cluster with high cohesion.
Similarly, if we now observe the right-hand figure and focus our attention to the green point and repeat the process of choosing any two other points and observe the angle it encloses with the pivot, we are likely to observe very less variance. Such a pattern shows that the point of concern is far away from the majority cluster and could potentially be an outlier. The entire process of detecting anomalies using the angle-based technique has a pretty high complexity of O(n³), as every time we need to make a triple with one pivot and then loop over all pairs for calculating the variance of enclosed angles.
A faster version of this is called Fast ABOD. It uses K-nearest neighbours to approximate the variance instead of calculating it from all the possible pairs for a given pivot. As the value of "K" grows in KNN, the algorithm converges to true variance and acts like its older version. The below figure shows an illustration of how Fast ABOD approximates outliers.
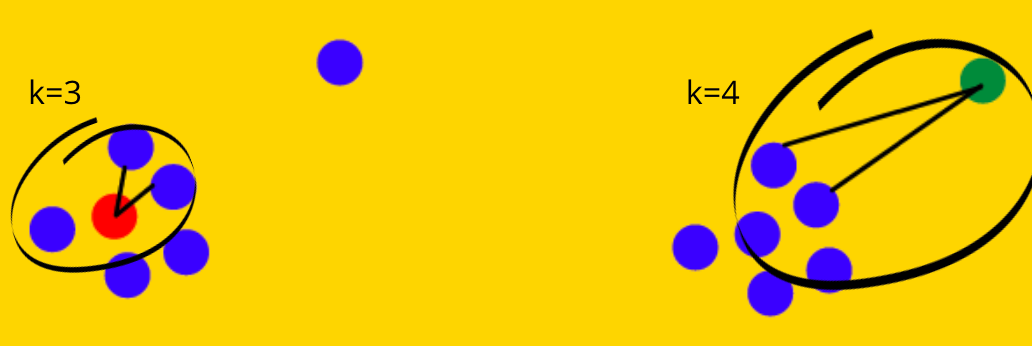
As can be seen for both the examples, only k-nearest neighbours are taken into consideration from the pivot pointc(red on left, green on right) for calculating the enclosed angle - making it blazingly fast.
Bring this project to life
Code
In this segment of the blog, we will go through a quick example and detect anomalies in a synthetic dataset using the PyOD package. PyOD is one of the most comprehensive and scalable Python toolkits for detecting outliers in multivariate data. It offers 40+ outlier detection algorithms ranging from traditional techniques to the latest developments in the area of targeting detection using proximity, ensemble, and neural network-based methods.
You can install PyOD using pip as shown below -
$> pip install pyodNext, we can generate 150 random samples in 2-D space using PyOD's generate_data method. I specifically chose 2-D space, and not any higher value, because of ease of visualizing it. I also set the contamination ratio to 10%, i.e 15 data points of 150 will be outliers. As mentioned in the documentation, the normal points are generated via multivariate Gaussian distribution and outliers are generated by a uniform distribution.
from pyod.utils.data import generate_data

X_train, Y_train = generate_data(
                                    n_train=150,
                                    n_features=2,
                                    train_only=True,
                                    contamination=0.1,
                                    random_state=42
                                 )

x1, x2 = X_train[:,0], X_train[:,1]
Let's see how does the data distribution looks like -
import matplotlib.pyplot as plt
%matplotlib inline

for idx, i in enumerate(Y_train):
  if i==0.0:
    color='blue'
  else:
    color='red'
  plt.scatter(x1[idx], x2[idx], c=color)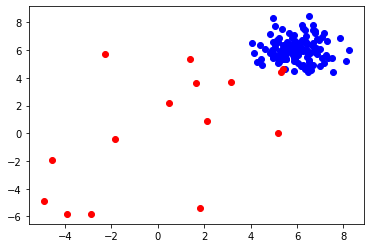
Next, we fit Fast ABOD by reducing the N^3 search space to calculating angles formed with just 10 neighbours. And then we go ahead and calculate the error %.
from pyod.models.abod import ABOD

abod_model = ABOD(contamination=0.1, method='fast', n_neighbors=10)
abod_model.fit(X_train)

pred = abod_model.predict(X_train)

error = (pred != Y_train).sum()
print (f'Error % = {(error/len(pred))*100}')
>> Error % = 2.6666
Next, we plot the prediction for both inliers and outliers.
import matplotlib.pyplot as plt
%matplotlib inline

for idx, i in enumerate(pred):
  if i==0.0:
    color='purple'
  else:
    color='orange'
  plt.scatter(x1[idx], x2[idx], c=color)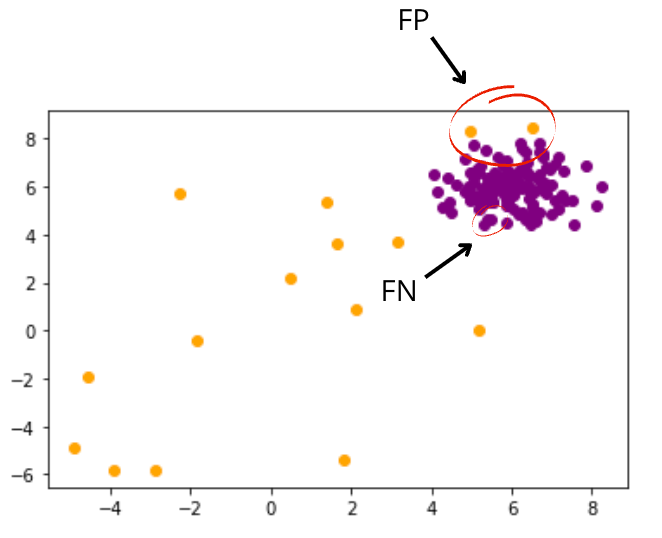
As can be seen in the figure above, orange and purple points are the predicted outliers and in-liners respectively. And our model makes in total 4 errors (2 False Positives, 2 False Negatives).
Concluding thoughts
So with this we wrap-up this blog. Feel free to checkout other algorithms offered by the PyOD library and try ensembling some of them for best results. Another popular unsupervised anomaly detection technique that people often use is called Isolation Forest. Feel free to check out this blog for an awesome walkthrough of the concept.
Thank you!