Introduction
GPUs are the premiere hardware for most users to perform deep and machine learning tasks. "GPUs accelerate machine learning operations by performing calculations in parallel. Many operations, especially those representable as matrix multiplies, will see good acceleration right out of the box. Even better performance can be achieved by tweaking operation parameters to efficiently use GPU resources." (1)
In practice, performing deep learning calculations is computationally expensive even if done on a GPU. Furthermore, it can be very easy to overload these machines, triggering an out of memory error, as the scope of the machine's capabilities to solve the assigned task is easily exceeded. Fortunately, GPUs come with built-in and external monitoring tools. By using these tools to track information like power draw, utilization, and percentage of memory used, users can better understand where things went wrong when things go wrong.
GPU Bottlenecks and Blockers
Preprocessing in the CPU
In many deep learning frameworks and implementations, it is common to perform transformations on data using the CPU prior to switching to the GPU for higher-order processing. This pre-processing can take up to 65% of epoch time, as detailed in this recent study. Work like transformations on image or text data can create bottlenecks that impede performance. Running these same processes on a GPU can add project-changing efficiency to training times.
What causes out-of-memory (OOM) errors?
An out-of-memory means the GPU has run out of resources to allocate for the assigned task. This error often occurs with particularly large data types, like high-resolution images, when batch sizes are too large, or when multiple processes run simultaneously. It is a function of the amount of GPU RAM that can be accessed.
Suggested solutions for OOM
- Use a smaller batch size. Since iterations are the number of batches needed to complete one epoch, lowering the batch size of the inputs will lessen the amount of data the processes the GPU needs to hold in memory for the duration of the iteration. This is the most common solution for OOM error
- Are you working with image data and performing transforms on your data? Consider using a library like Kornia to perform transforms using your GPU memory
- Consider how your data is being loaded. Consider using a DataLoader object instead of loading in data simultaneously to save working memory. It does this by combining a dataset and a sampler to provide an iterable over the given dataset
Command line tools for monitoring performance:
nvidia-smi
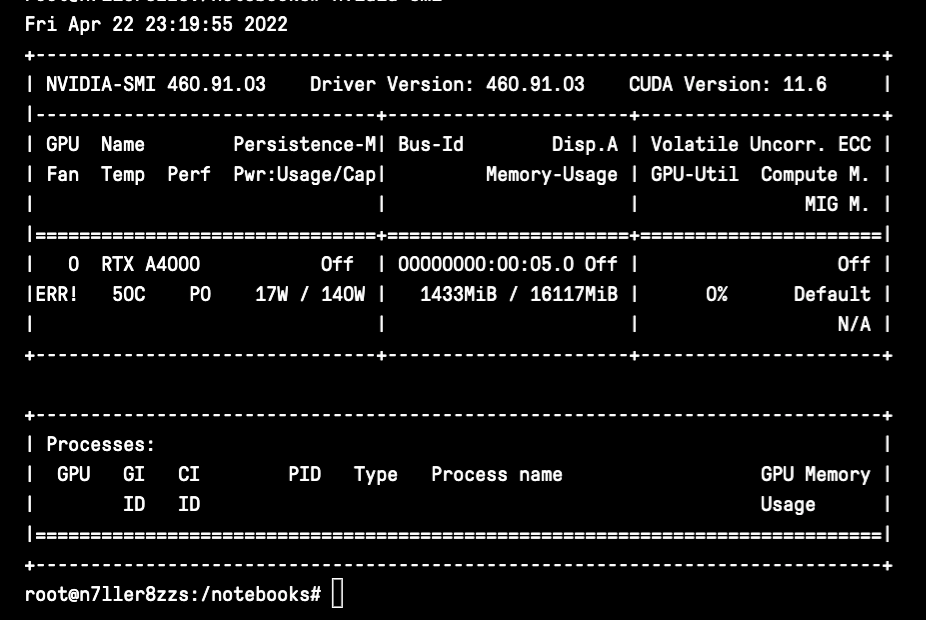
Standing for the Nvidia Systems Management Interface, nvidia-smi is a tool built on top of the Nvidia Management Library to facilitate the monitoring and usage of Nvidia GPUs. You can use nvidia-smi to print out a basic set of information quickly about your GPU utilization. The data in the first window includes the rank of the GPU(s), their name, the fan utilization (though this will error out on Gradient), temperature, the current performance state, whether or not you are in persistence mode, your power draw and cap, and your total GPU utilization. The second window will detail the specific process and GPU memory usage for a process, like running a training task.
Tips for using nvidia-smi
- use
nvidia-smi -q -i 0 -d UTILIZATION -l 1to display GPU or Unit info ('-q'), display data for a single specified GPU or Unit ('-i', and we use 0 because it was tested on a single GPU Notebook), specify utilization data ('-d'), and repeat it every second. This will output information about your Utilization, GPU Utilization Samples, Memory Utilization Samples, ENC Utilization Samples, and DEC Utilization Samples. This information will loop to output every second, so you can watch changes in real time. - Use the flags "-f" or "--filename=" to log the results of your command to a specific file.
- Find the full docs here.
Glances
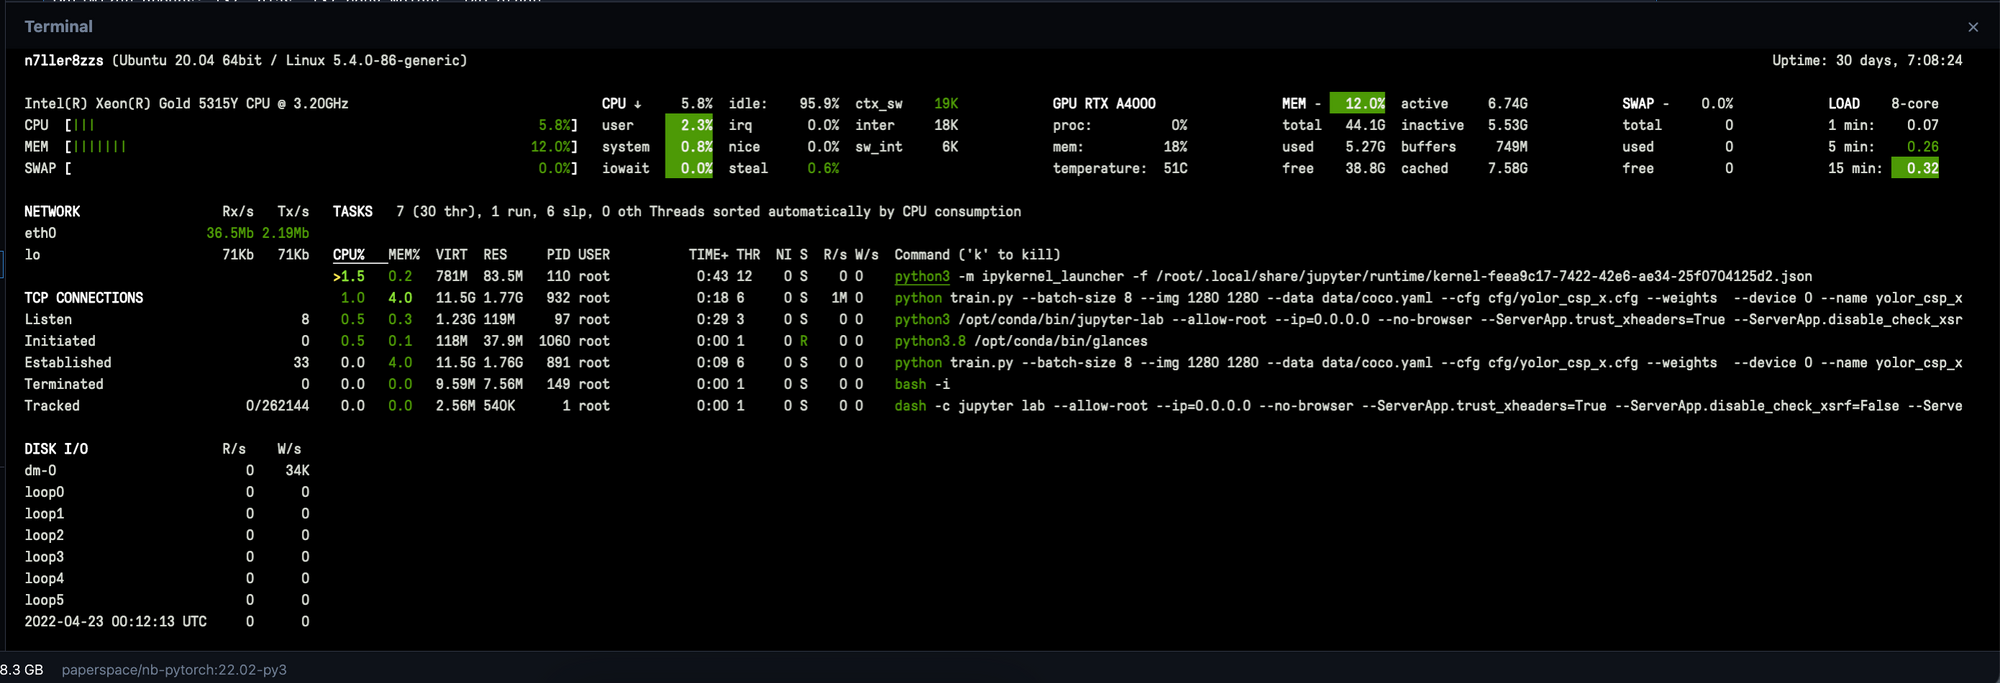
Glances is another fantastic library for monitoring GPU utilization. Unlike nvidia-smi, entering glances into your terminal opens up a dashboard for monitoring your processes in real time. You can use this feature to get much of the same information, but the realtime updates offer useful insights about where potential problems may lie. In addition to showing relevant data about utilization for your GPU in real time, Glances is detailed, accurate, and contains CPU utilization data.
Glances is very easy to install. Enter the following in your terminal:
pip install glances
and then to open the dashboard and gain full access to the monitoring tool, simply enter:
glances
Read more in the Glances docs here.
Other useful commands
Be wary of installing other monitoring tools on a Gradient Notebook. For example, gpustat and nvtop are not compatible with Gradient Notebooks. The following are some other built-in commands that can help you monitor processes on your machine.
These are more focused towards monitoring CPU utilization:
top- print out CPU processes and utilization metricsfree- tells you how much memory is being used by CPUvmstat- reports information about processes, memory, paging, block IO, traps, and cpu activity
Closing remarks
In this article, we understood that monitoring GPU utilization is critical for optimizing deep learning workflows, ensuring efficient resource use, and maximizing model training performance. By tracking key metrics like memory usage, GPU temperature, and computational load, you can identify bottlenecks, fine-tune models, and make informed decisions about scaling and resource allocation. Effective GPU monitoring transforms raw hardware power into tangible model improvements and faster development cycles.