
The concept of using photography in surveying and mapping to measure distances between objects is known as photogrammetry. This is achieved by looking at the same object from a sequence of photos taken at different angles and distances. By triangulating these distances across some object, it is possible to create a 3-dimensional representation of the object, land, or space in question, and we can then make use of the 3D model for a plethora of different tasks like making measurements. This process is heavily leveraged in numerous and varied use cases, like land surveying, medicine, or sports. For example, aerial photogrammetry of a piece of land can massively improve engineers, architects, and construction team's ability to make informed decisions about work on the plot.
The arguably most popular software for photogrammetry is Pix4D, which is optimized for aerial photogrammetry using photos captured from drones for various purposes like land surveying, construction, and agricultural planning. The main products for this task from Pix4D are Pix4Dmapper and Pix4Dmatic. Pix4Dmapper is the main software for professional drone mapping, and Pix4Dmatic is designed to do the same work on larger scale projects. In this blog post, we will take a starting look at Pix4Dmapper and an in depth look at Pix4Dmatic. We will then learn how to set Pix4Dmatic up on Paperspace Core to process a sample dataset.
Let's see how we can use powerful GPUs to work with the necessarily large data required for photogrammetry tasks.
Why use photogrammetry?
Pix4D is arguably the premiere service for aiding land surveying and drone mapping at scale, but what is the actual, functional use case for this technology?
Pix4Dmapper is Pix4D's smaller scale drone mapping software. With Pix4Dmapper, it is possible to capture RGB, thermal, or multispectral images with any camera or drone, digitize the ground or aerial images into usable, 3D, and digital representations in the application, and then use these representations to create accurate measurements and inspections of the data of interest. These measurements can then be used to aid in numerous tasks like guiding construction, land surveying, and much more. Pix4Dmapper is, however, limited in how much data it can process quickly.
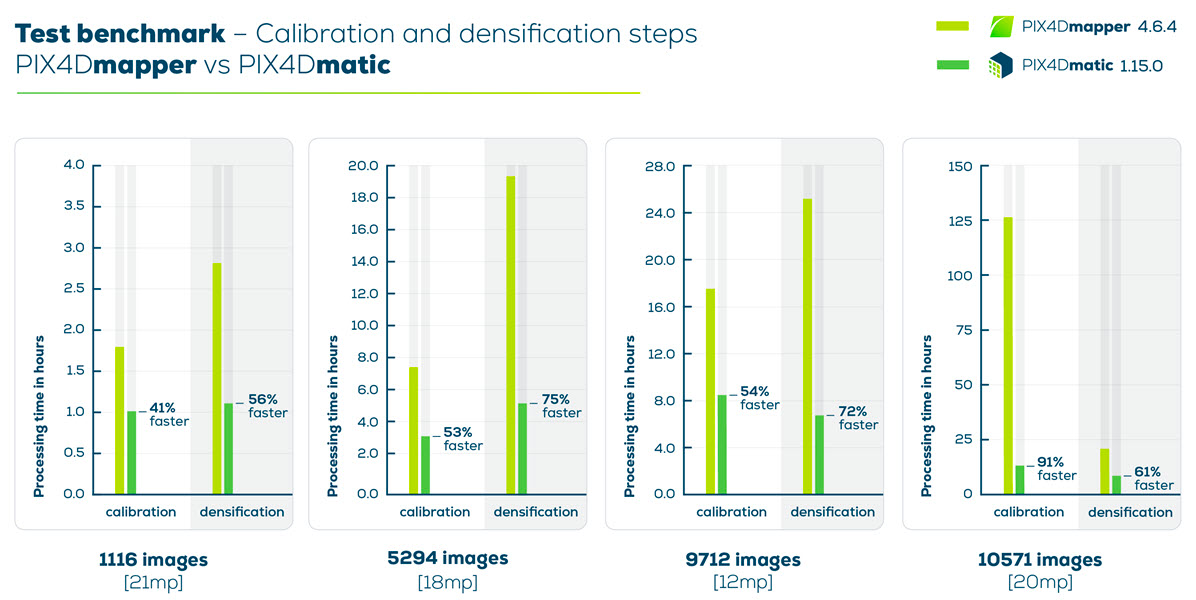
Pix4Dmatic is Pix4D's solution to working with Big Data. It allows for next-generation photogrammetry of terrestrial, corridor and large scale mapping. Pix4Dmatic is otherwise functionally very similar to Pix4Dmapper, but has significant speed ups on the processing steps for photogrammetry. Because we have access to a large example dataset and a Core GPU, we will use Pix4Dmatic in this tutorial.
Set up: Core
Before getting started, load up a Windows Core Machine on Paperspace. I recommend you choose one of the Ampere machine types (A4000, A5000, A6000, and A100) if they are available, as Pix4D is highly computationally expensive to run. The recommendation is to have at least 32 GB (2'000-5'000 images at 20 MP) to 64 GB (5'000-10'000 images at 20 MP) of CPU RAM, and at least 100 GB - 200 GB free memory space (2'000-5'000 images at 20 MP). You can change the amount of storage available in the Core machine create page in the "machine type" section.
Once you've finished these steps, hit "Create" at the bottom to create the Core machine. Then, click on the "Launch" button in the GUI to access your Windows desktop.
Set up: Pix4D
Now, we are in our Core machine. The first thing we need to do to get started is to create an account with Pix4D and download the software. Pix4D is a commercial product, so you will need to sign up for a paid account to use the software suite. You can, however, gain access to a 15 day free trial period for demoing their products, if you so choose.
To get started making your account, go to this page, scroll down to the section labeled Pix4Dmatic, and click "start your 15 day trial" if you do not already have an account. Follow the instructions on the page from there to finish setting up your account.
Now that you are logged in and have a license, go to the Pix4Dmatic page again, and download the application. Run the installer to complete set up. Next, we need to make sure Pix4DMatic makes use of the GPU we have made available. To do so, go first to your system settings by clicking the Windows button in the bottom left hand corner of the screen and then clicking the "gear" symbol to go to settings. From the window, search for "graphics settings" and navigate to that page. From there, go to the "Add an app" section, click "browse," and then locate your "pix4dmatic.exe" in Program Files/Pix4dmatic. Add it to the custom graphics settings menu GUI with the eselection "High performance" to ensure your application makes use of your GPU.
The second step we need to complete to set up our demo is grabbing some example data to use for the sample project. Fortunately, Pix4D provides its users with a robust selection of sample datasets and projects we can make use of for this purpose. Open up the link in your Core machine and scroll to the Pix4Dmatic section. For today's example, we will download and make use of the Urban area dataset. The urban area dataset is a 100 image subset of an originally larger 10615 image dataset, and "image acquisition of the whole dataset was done using 4 eBee X - senseFly drones flying simultaneously" [source]. Download and unzip the dataset.
Bring this project to life
Loading in the data
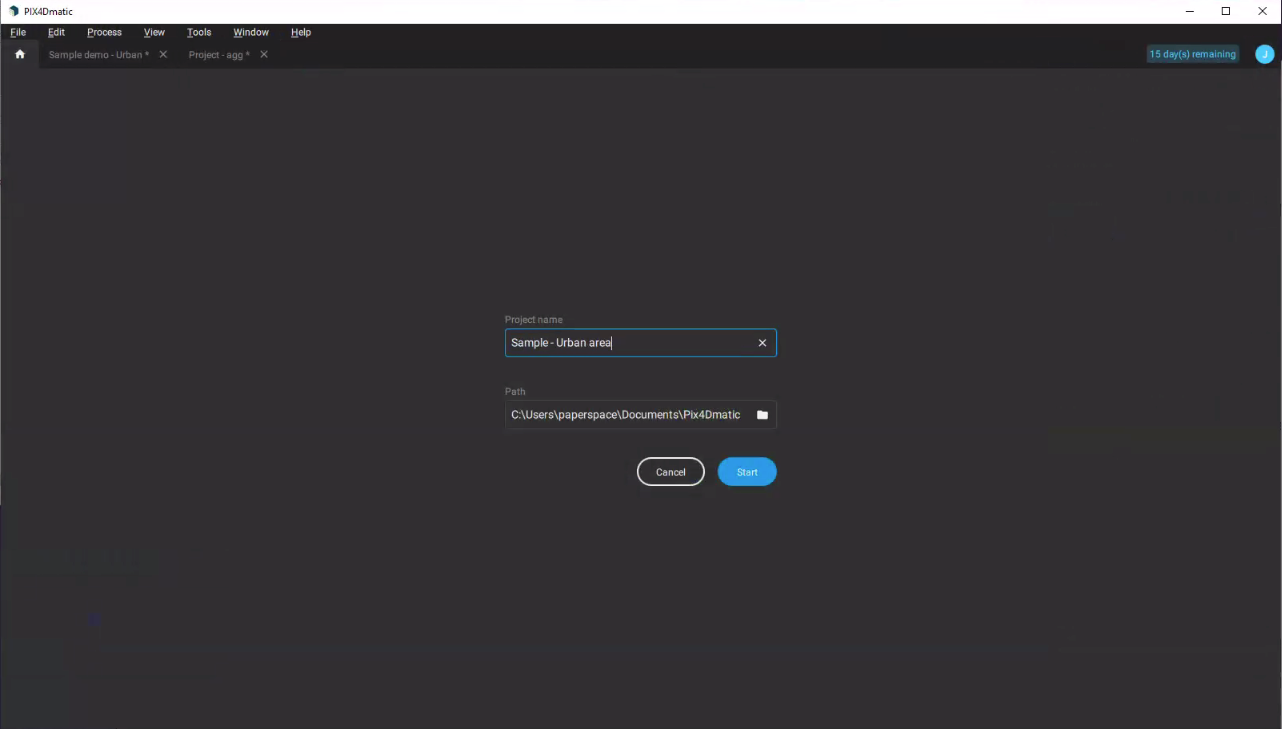
Now that we have our data and software setup, we can get started with our photogrammetry task. Load up the application, and click File > New to start a new project in the application. You can leave the path as the default folder, but it's a good idea to rename the project to represent the example nature of the work.
Now in your new project, we can load in our data by simply dragging and dropping the file containing the contents of the dataset zip file into the window. This will then automatically populate the map feature space with 100 images organized by their geographic location.
Next, we have the somewhat optional step of assigning Ground Control Points (GCPs). "GCPs are characteristic points whose coordinates are known. Their coordinates have been measured with traditional surveying methods or have been obtained by other sources (LiDAR, older maps of the area, or a Web Map Service). GCPs are used to georeference a project and reduce the noise." [Source] While they aren't absolutely needed for a photogrammetry task to succeed, they are very useful for enhancing the quality of our output object.
Process the data
For this next step, make sure that you have activated your license for Pix4Dmatic. If you do not, only the first two options for processing will be available and you will not be able to output the report.
To process our now uploaded and set up urban area dataset, select the button with a play button within in the top right of the screen. This will open up the processing menu. At the top, you can change the processing template to reflect the different types of drone flying and image capture pattern used. In this case, we will use the default "nadir".
It then gives you 5 processing options: calibrate, densify, mesh, DSM, and orthomosaic. You can click the toggle by each of these to add them to our process workflow. Let's discuss what each of these do:
Calibrate
The calibrate processing option is there to help prepare the Pix4Dmatic data for other processing options, and works by further optimizing the data for the future run. In practice, this means assigning a calibration template to decide what processing options will be used, a pipeline to allow the user to control the cameras internal and external parameters, the image scale defines the image size used to extract the keypoints, a setting for determining the number of extracted keypoints. and an internals confidence metric to set the confidence of the initial camera calibration. Confidence determines how much the cameras can be recalibrated and adjusted during calibration.
Densify
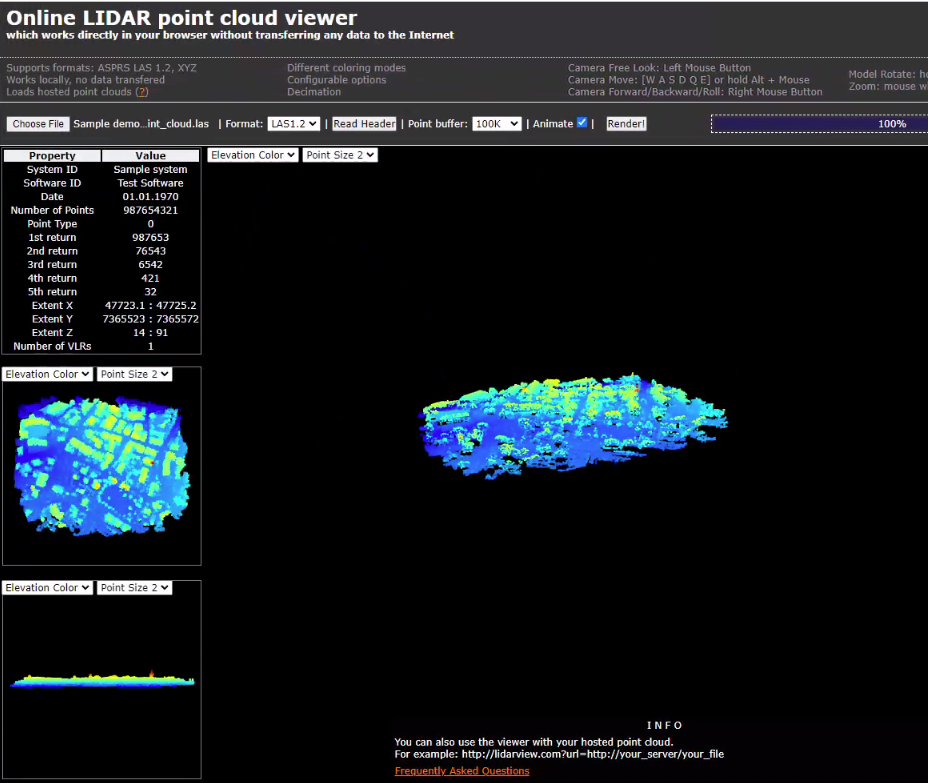
The densify processing step creates a dense point cloud from the submitted data. Dense point clouds are a common starting place for 3D object modeling, and are represented by a series of measurements about the locations of numerous points in a feature space. They are calculated in photogrammetry tasks by measuring numerous points on the surface of the image, and then using those distances to infer a now 3 dimensional understanding of the objects relative positions to one another.
Mesh
In 3D computer graphics and solid modeling, a polygon mesh is a collection of vertices, edges and faces that defines the shape of a polyhedral object. During the mesh stage of processing, Pix4Dmatic generates and then extracts a mesh representation of the objects in our feature space. This mesh (a .obj file) can then be used in numerous 3rd party applications like SculptGL or Blender.
Digital Surface Model (DSM)
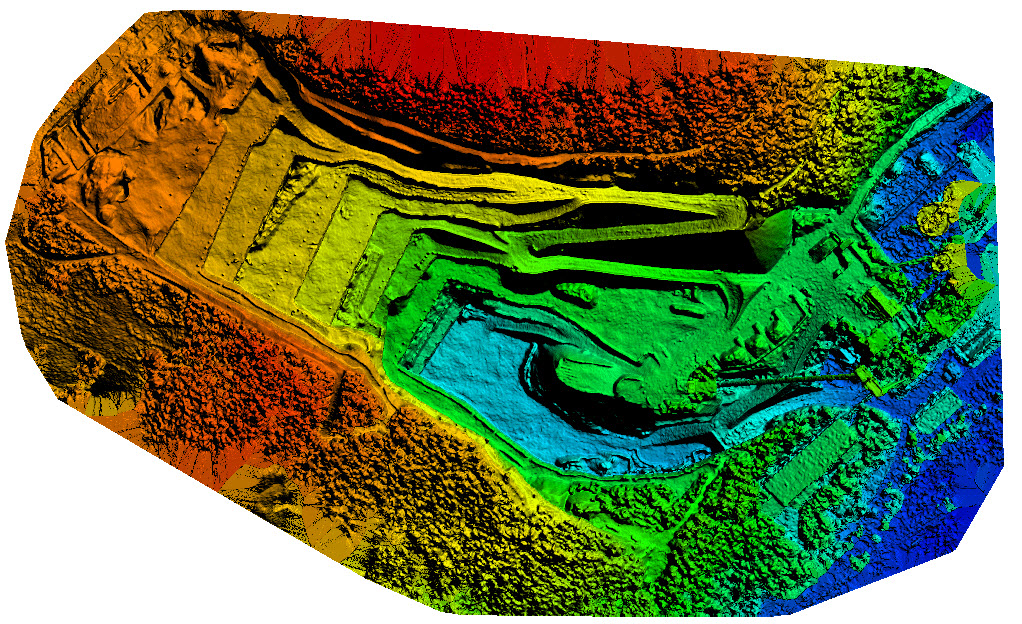
The DSM step takes in the dense point cloud as input and works to define the Resolution, enable Surface smoothing and enable Interpolation for the digital surface model (DSM) creation. The DSM is labeled as a 2.5 D model of the area of interest. It can be exported as two different types of files: Raster GeoTIFF or as a Point cloud (.xyz, .las, .laz). Each pixel of the raster geotiff file and each point of the point cloud contain displacement information in 3 dimensions, (X, Y, Z), but they do not have a fourth dimension to represent captured color. For each (X,Y) position, the DSM has only 1 Z value (the altitude of the highest point for this (X,Y) position).
Orthomosaic
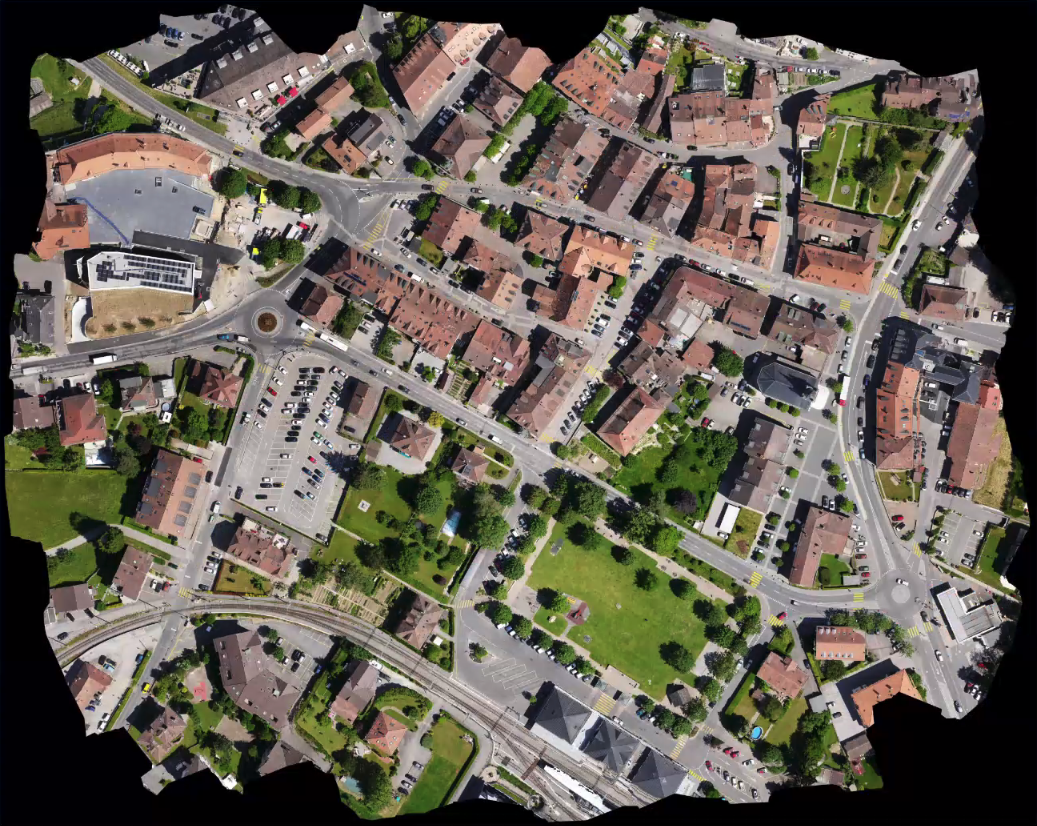
The orthomosaic is a 2D representation of the collected images that has information about X, Y, and color values for the mapped area. It differs from photostitching in that the orthorectification method removes the perspective distortions from the images using the DSM. This does, however, require a high number of matches/keypoints (more than 1000) to generate the model. In effect, the orthomosaic corrects the perspective of the camera and augments the representation to use a different scale based on the distance that each point of the object/ground has from the camera. This allows orthomosaics to be so useful for making measurements, as the object was created with regard to the relative distances and sizes of the objects pictured with regard to one another.
Putting it all together
Before you click start to run your processing, note that there is an additional section titled "exports" at the bottom of the screen. These exports will determine what we have available to examine afterwards. If you need an outputted .obj file or DSM GeoTIFF, for example, be sure to select those boxes. Otherwise, you can just output the quality report for now and click "start."
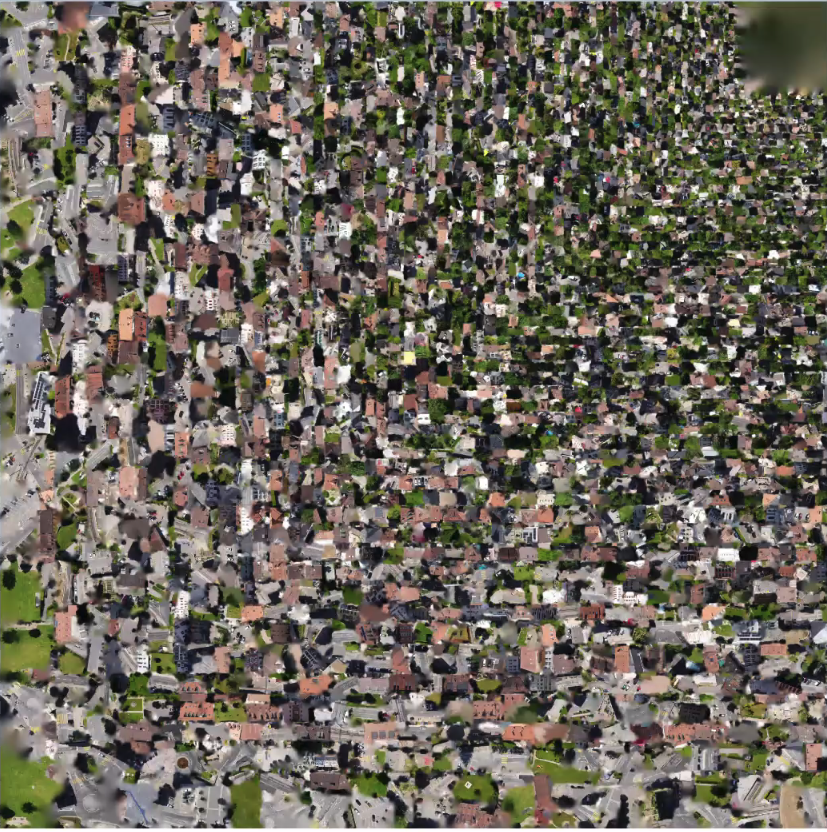
After processing, we can start looking around our newly created 3D representation of the urban area dataset. By doing so, we can get a better understanding of how this model was created. By clicking on each of the tie points, we can see how each of the "cameras" different angles together has a direct line of site to the points. Each of these different line of sights gives different information for Pix4D to use to create this 3D representation.
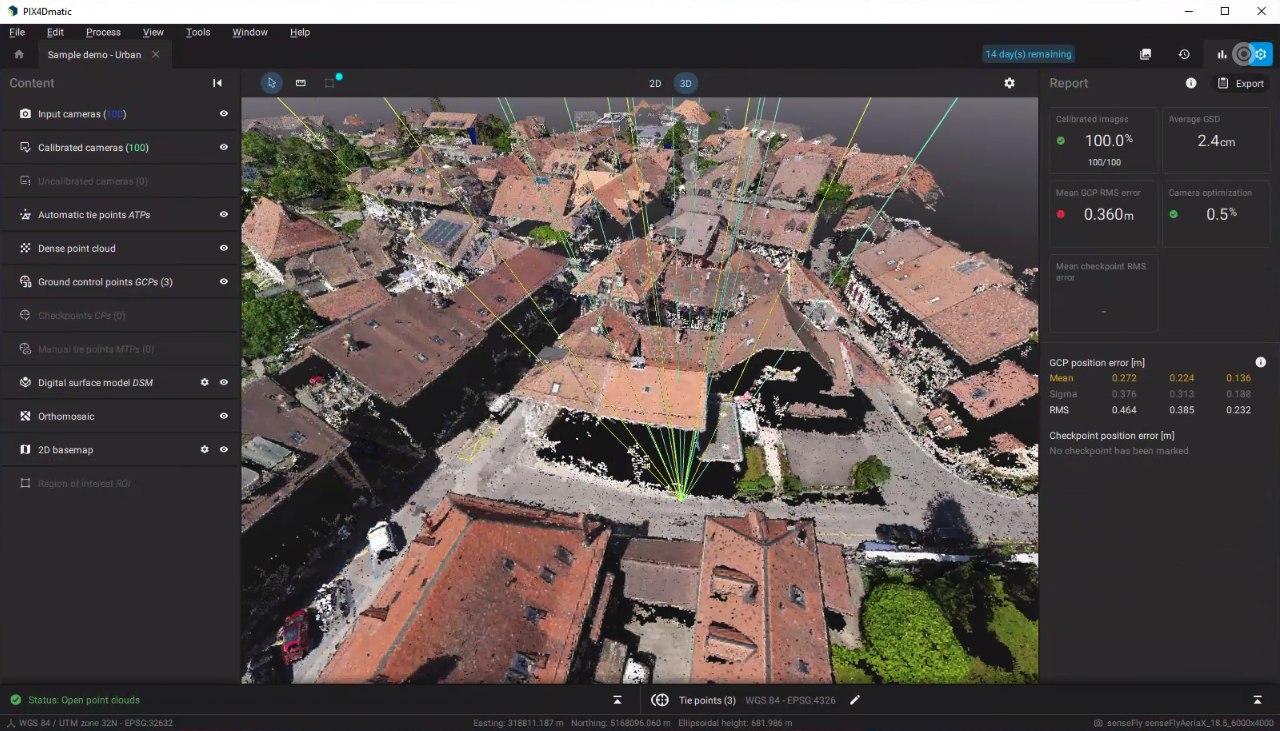
The example above is not perfect however, and we can see when we zoom in that there are large segments of the model that are black or blank. The reason for this is two fold: first, its impossible to capture every bit of information even with the wide net of cameras, and second, the capability of Pix4Dmatic is directly related to how many cameras and how well the GCP tie points were marked. By clicking the bar graph symbol in the top right of the window, we can access the report assessing the quality of our information extraction. As we can see, there is a mean GCP RMS error of .36 meters across all of the images used. This is a rather large error, and we can likely improve massively upon this model output by stepping back and remarking all the tie points to the GCPs more accurately.
Examining our processed data
Now that our 3D representation has been processed and is ready to go, we can begin using the provided photogrammetry tools to make measurements in our image. This is the true utility of photogrammetry with Pix4D. By taking measurements through the software, its possible to save meaningful time and energy making physical measurements in person. It also allows people like us, on our computers in varying nations, to conduct the same work from across the planet using just drones and Pix4D's robust software suite.
You can make simple measurements by selecting the ruler icon in the top left of the screen below the menu bar. Then, just drag your mouse across the location in question to measure the distance between the two points.
Closing thoughts
Pix4dmatic is a really powerful tool for conducting photogrammetry at scale. Users can expect the application to be capable of handling hundreds to thousands of camera inputs to create large 3D scene models at a much higher speed than is possible with Pix4dmapper. If you are planning to conduct photogrammetry on a large scale, then Pix4dmatic is absolutely the premiere software to run with your Core machine.