Introduction
We recently teamed up with folks from RAPIDS and Plot.ly to demonstrate how to generate a web app to perform complex dataset visualizations – all from a Gradient Notebook running on Paperspace.
We're pleased to release the result of this collaboration as a new ML Showcase entry. As with all ML Showcase entries, we invite you to fork these notebooks over to your own team and start exploring!

Note: It is strongly recommended that you run the notebook on a P4000, P5000, or higher GPU instance as the libraries used in the notebook are only compatible with Pascal and newer NVIDIA GPU architectures.
Bring this project to life
Getting acquainted
If you're not familiar already, RAPIDS is a collection of open-source libraries from NVIDIA aimed at porting classical machine learning capabilities directly to GPU.
The advantages of RAPIDS are multiple however in general the idea is to optimize tasks that benefit from GPU parallelism like loading large data chunks into memory or any other tasks that benefit from increasing the number of processor cores.
There are several demo notebooks within this ML Showcase project. You can explore the GitHub source code yourself here:
All notebooks use the RAPIDS framework from NVIDIA and a few also incorporate Dash from Plot.ly.
By working through these notebooks, you'll gain familiarity with a number of exciting libraries as well as how to deploy an app to an external endpoint using a proxy – all within a notebook!
Let's get started
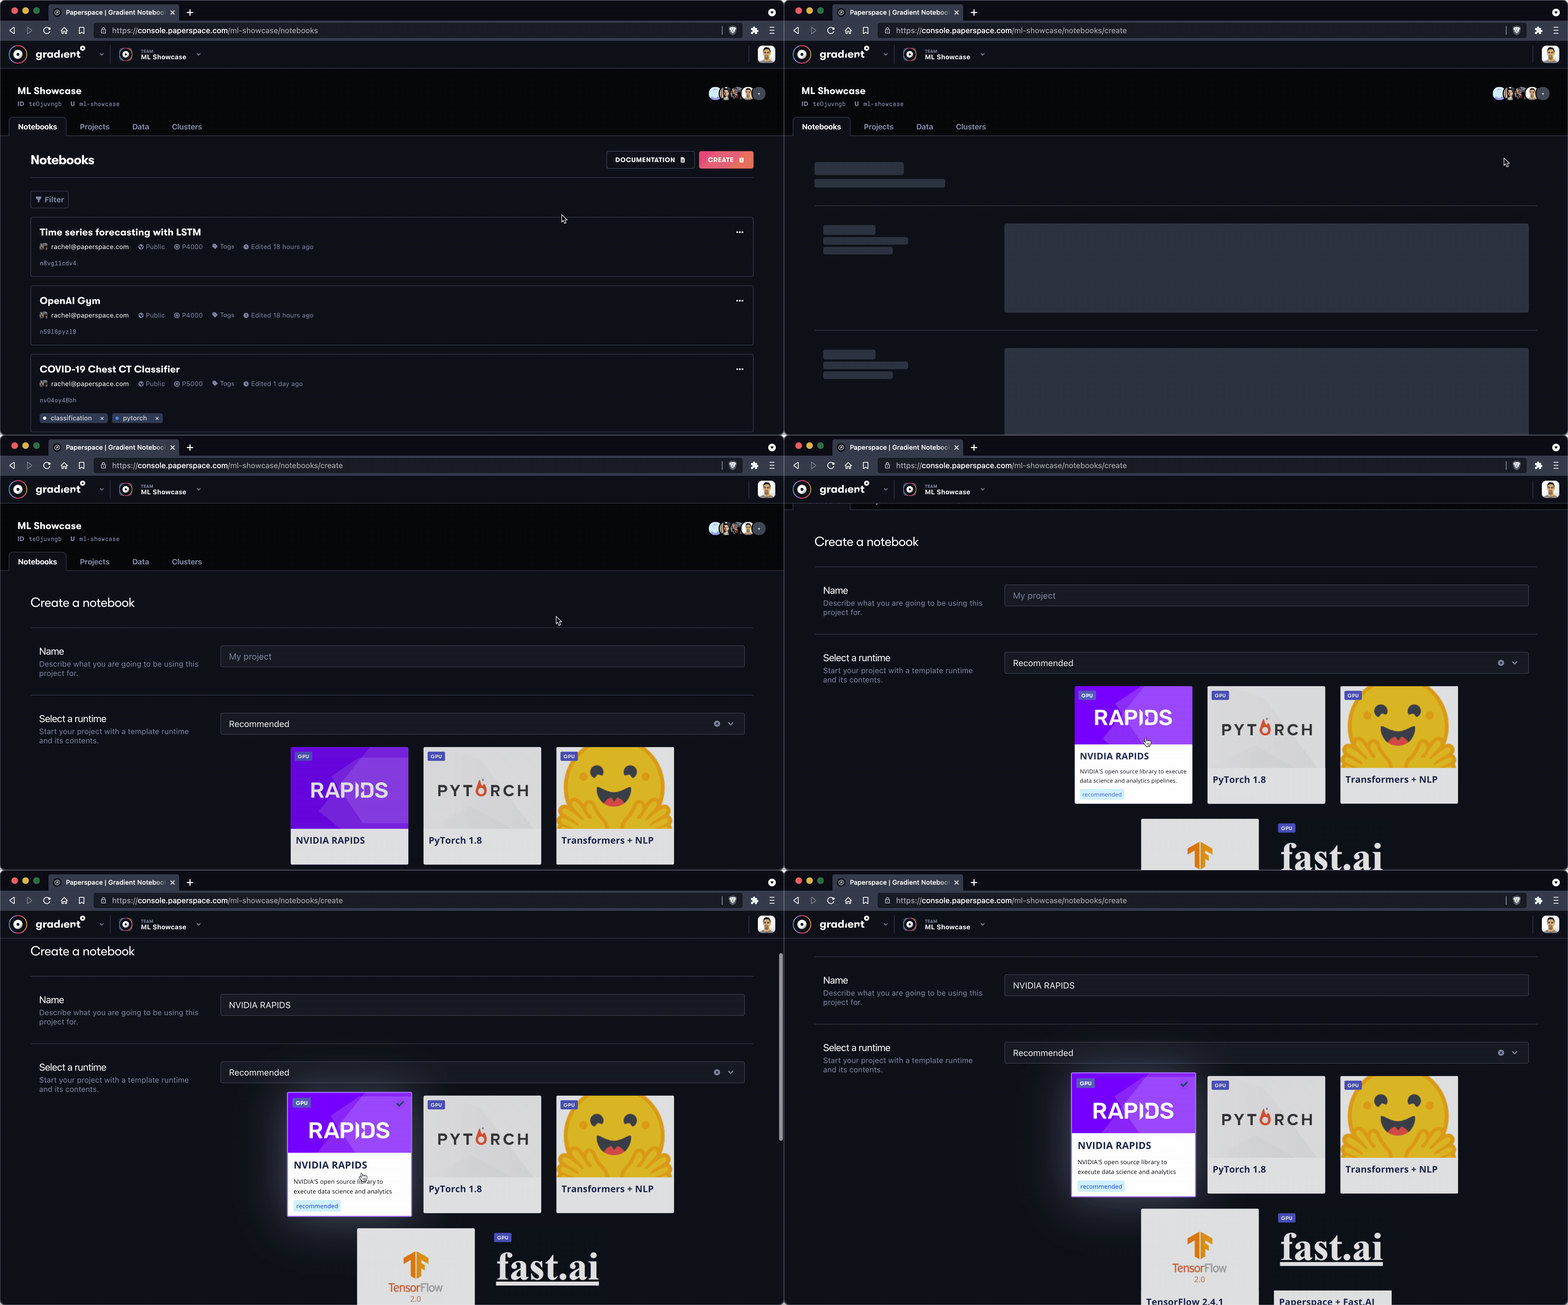
The first thing we'll do is create a new notebook by using the Create Notebook feature in the Paperspace Gradient console. Make sure to give your notebook a name and select the RAPIDS tile as your runtime.
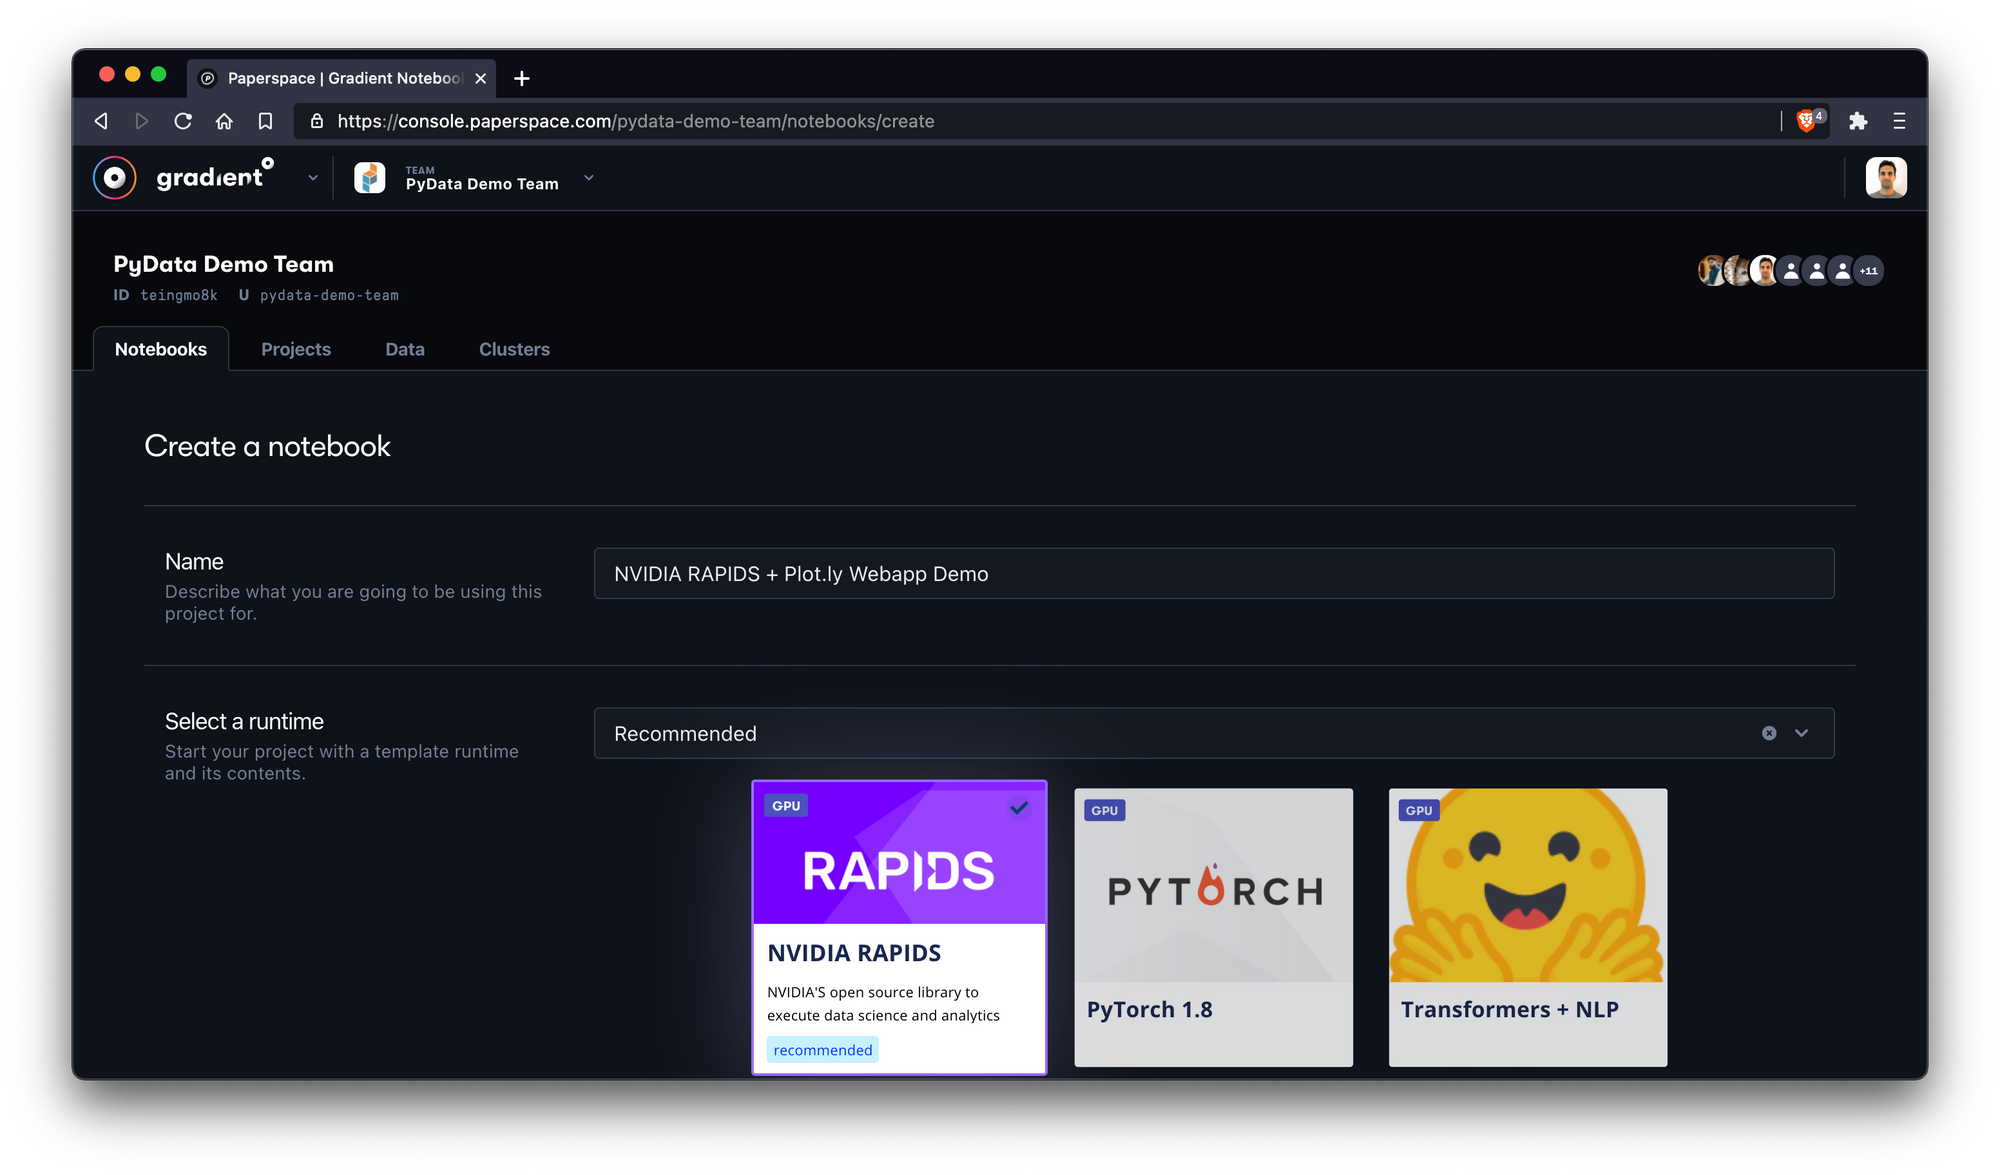
Note: When you select a runtime tile it's equivalent to specifying a Workspace URL, Container Name, and Container Command – options that may also be specified manually in the Advanced Options section of the Create Notebook view.
Next, we'll select a machine type. Here we choose the NVIDIA Quadro P6000 with 30GB RAM and QTY 8 vCPUs.
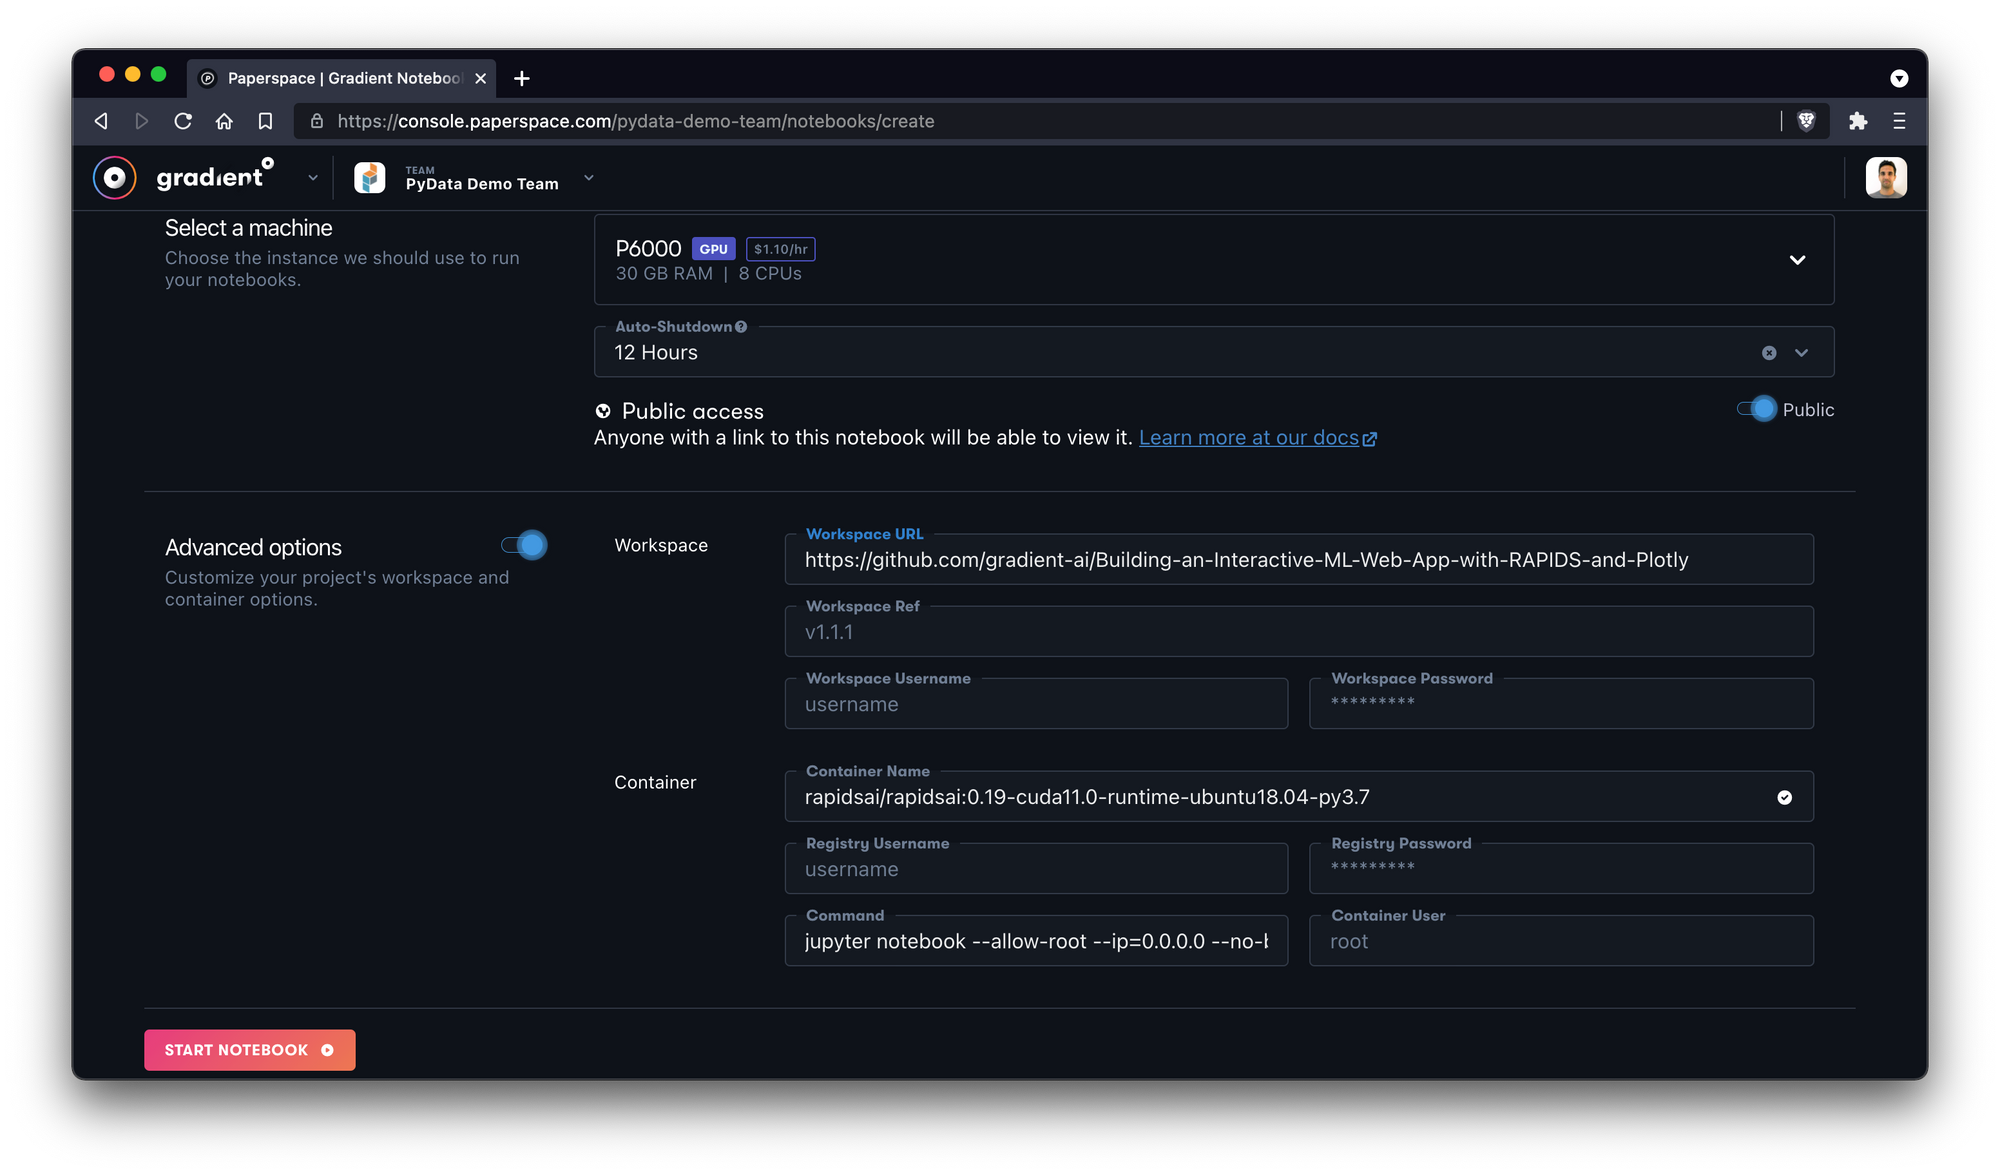
We'll also toggle Advanced Options and manually add the GitHub workspace we want the notebook to pull.
We'll be using this repo:
https://github.com/gradient-ai/Building-an-Interactive-ML-Web-App-with-RAPIDS-and-Plotly
After we click Start Notebook we'll wait a few moments for our notebook to boot.
Once it boots, we'll be able to see the different notebook files within the repository directly from the Gradient IDE.
In this image, we're exploring a part of the NYC taxi spatial notebook.
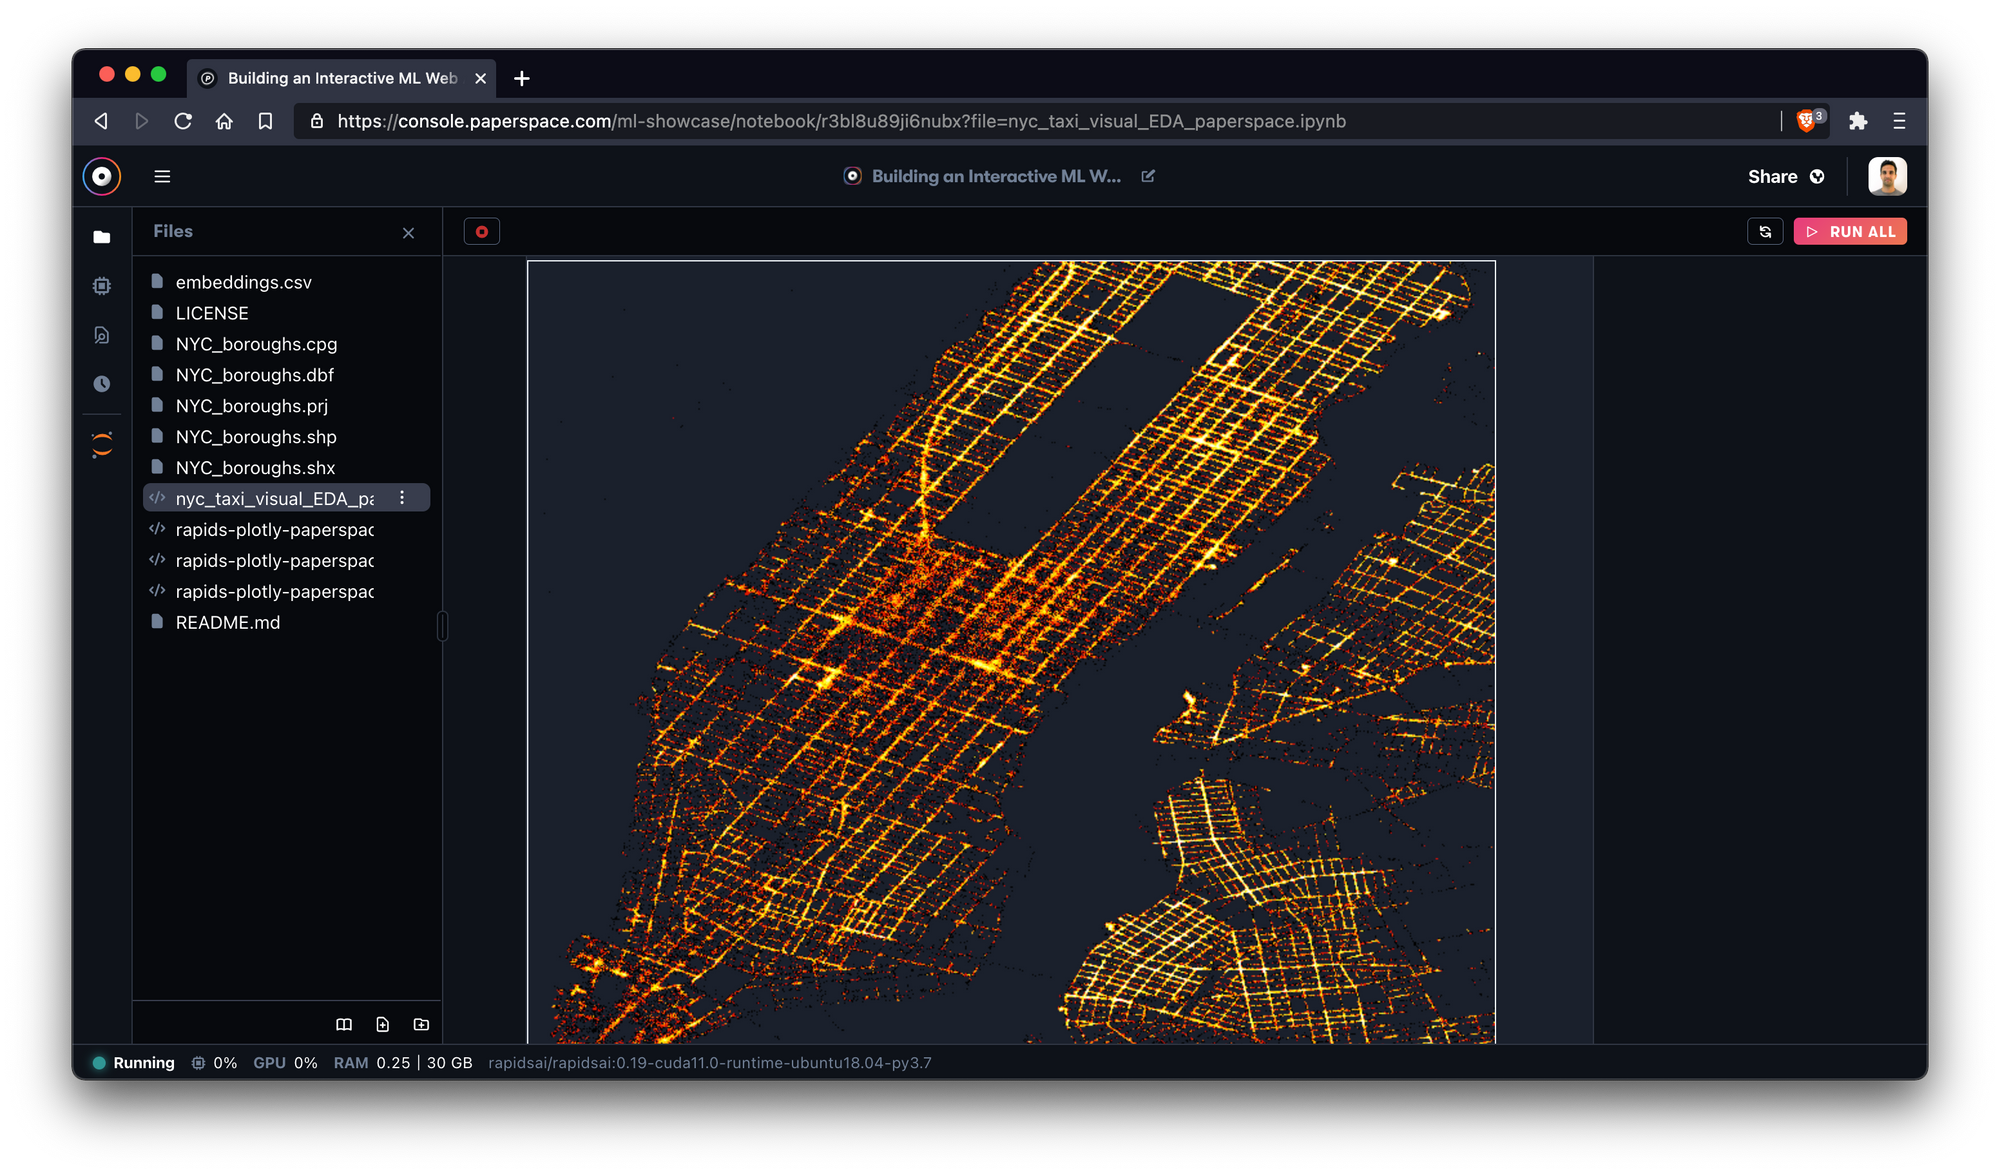
Excellent! To get the most out of the examples, we recommend starting with the NYC Taxi notebook which introduces key pieces of the RAPIDS ecosystem.
A note on the Gradient Notebooks IDE and JupyterLab
As you work through this notebook, you may sometimes need access to a full JupyterLab instance.
As an example, at the time of writing the Gradient IDE does not yet support javascript-based visualizations so you may receive this warning when running cells within the section labeled Create your charts and launch the dashboard:
Warning: Output format application/javascript is not supported at the moment.
Never fear! You can easily swap over to Jupyter via the icon in the left sidebar.
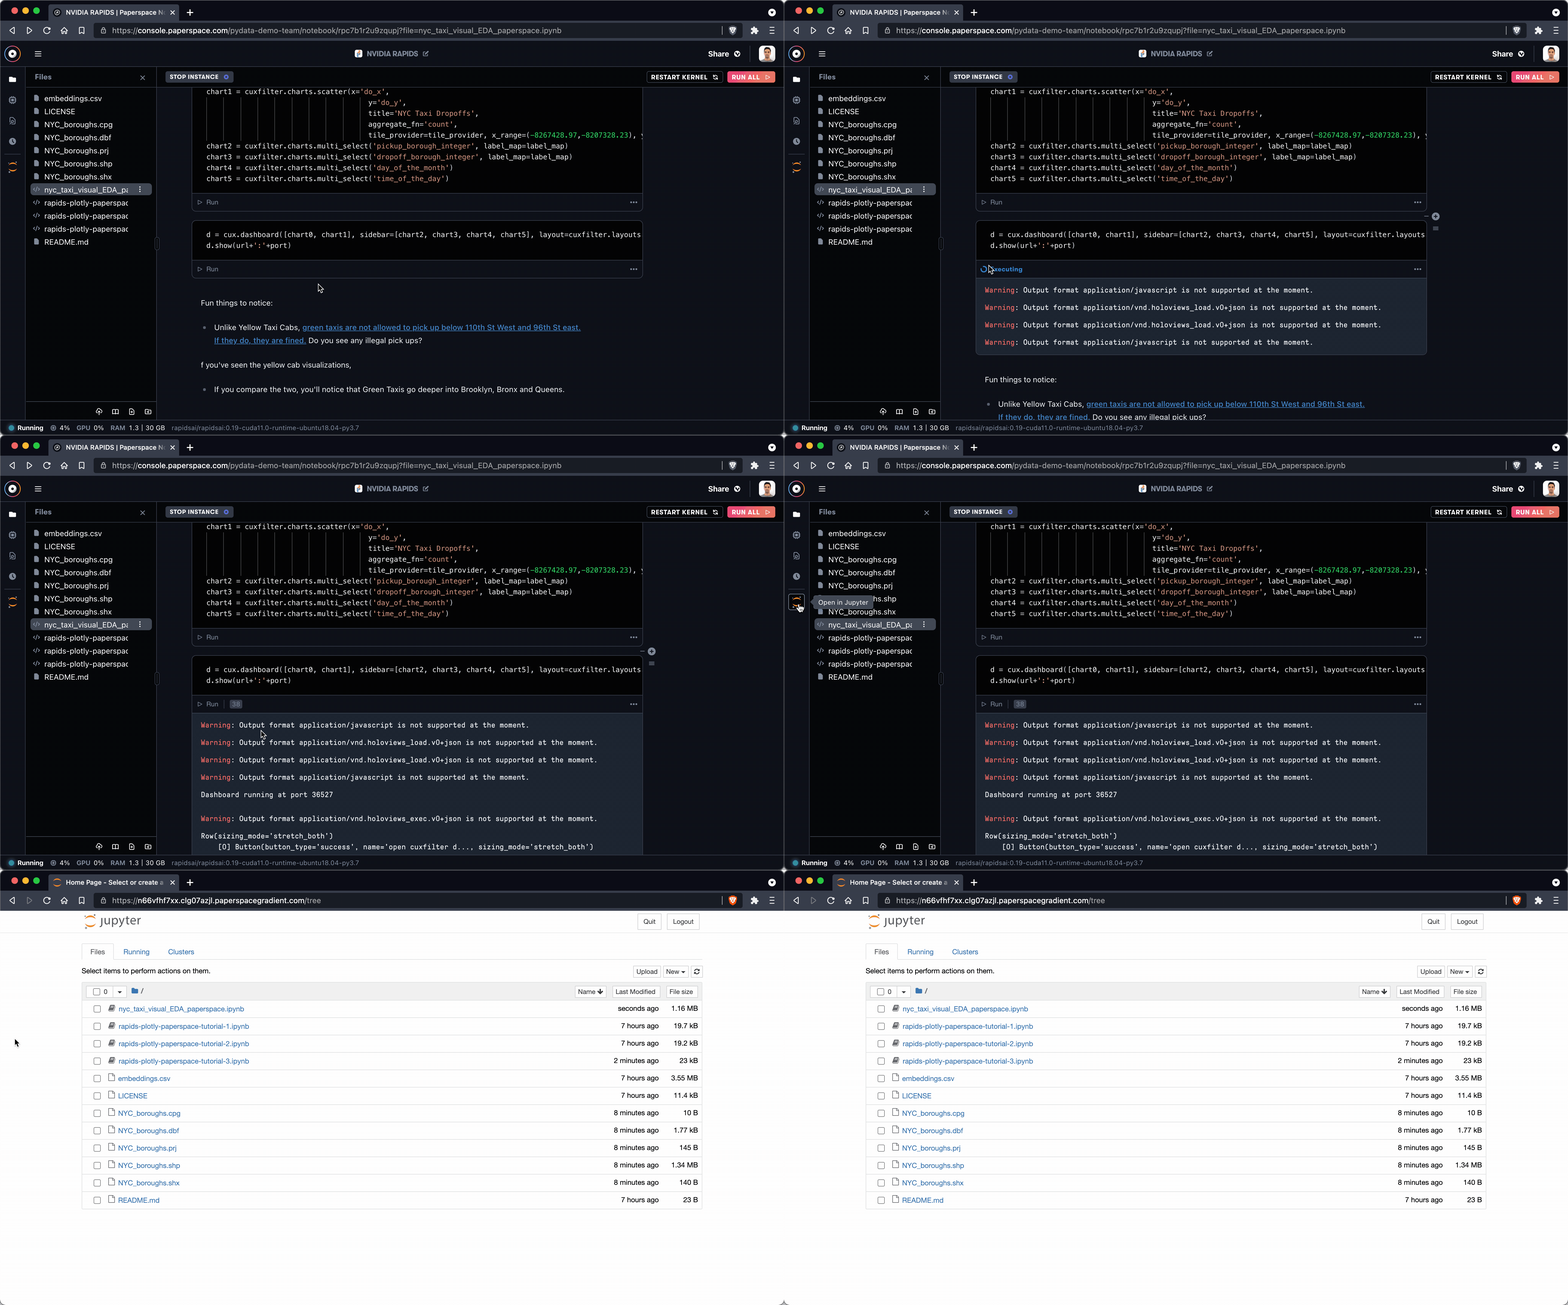
In general you should be able to perform most operations within the Gradient IDE – and new features are added constantly – but it's nice to know that JupyterLab is there when you need it.
NYC taxi spatial notebook
In this notebook, which was created by the team behind RAPIDS, we'll utilize a number of GPU-accelerated RAPIDS libraries to explore the behavior of taxicabs in New York City.
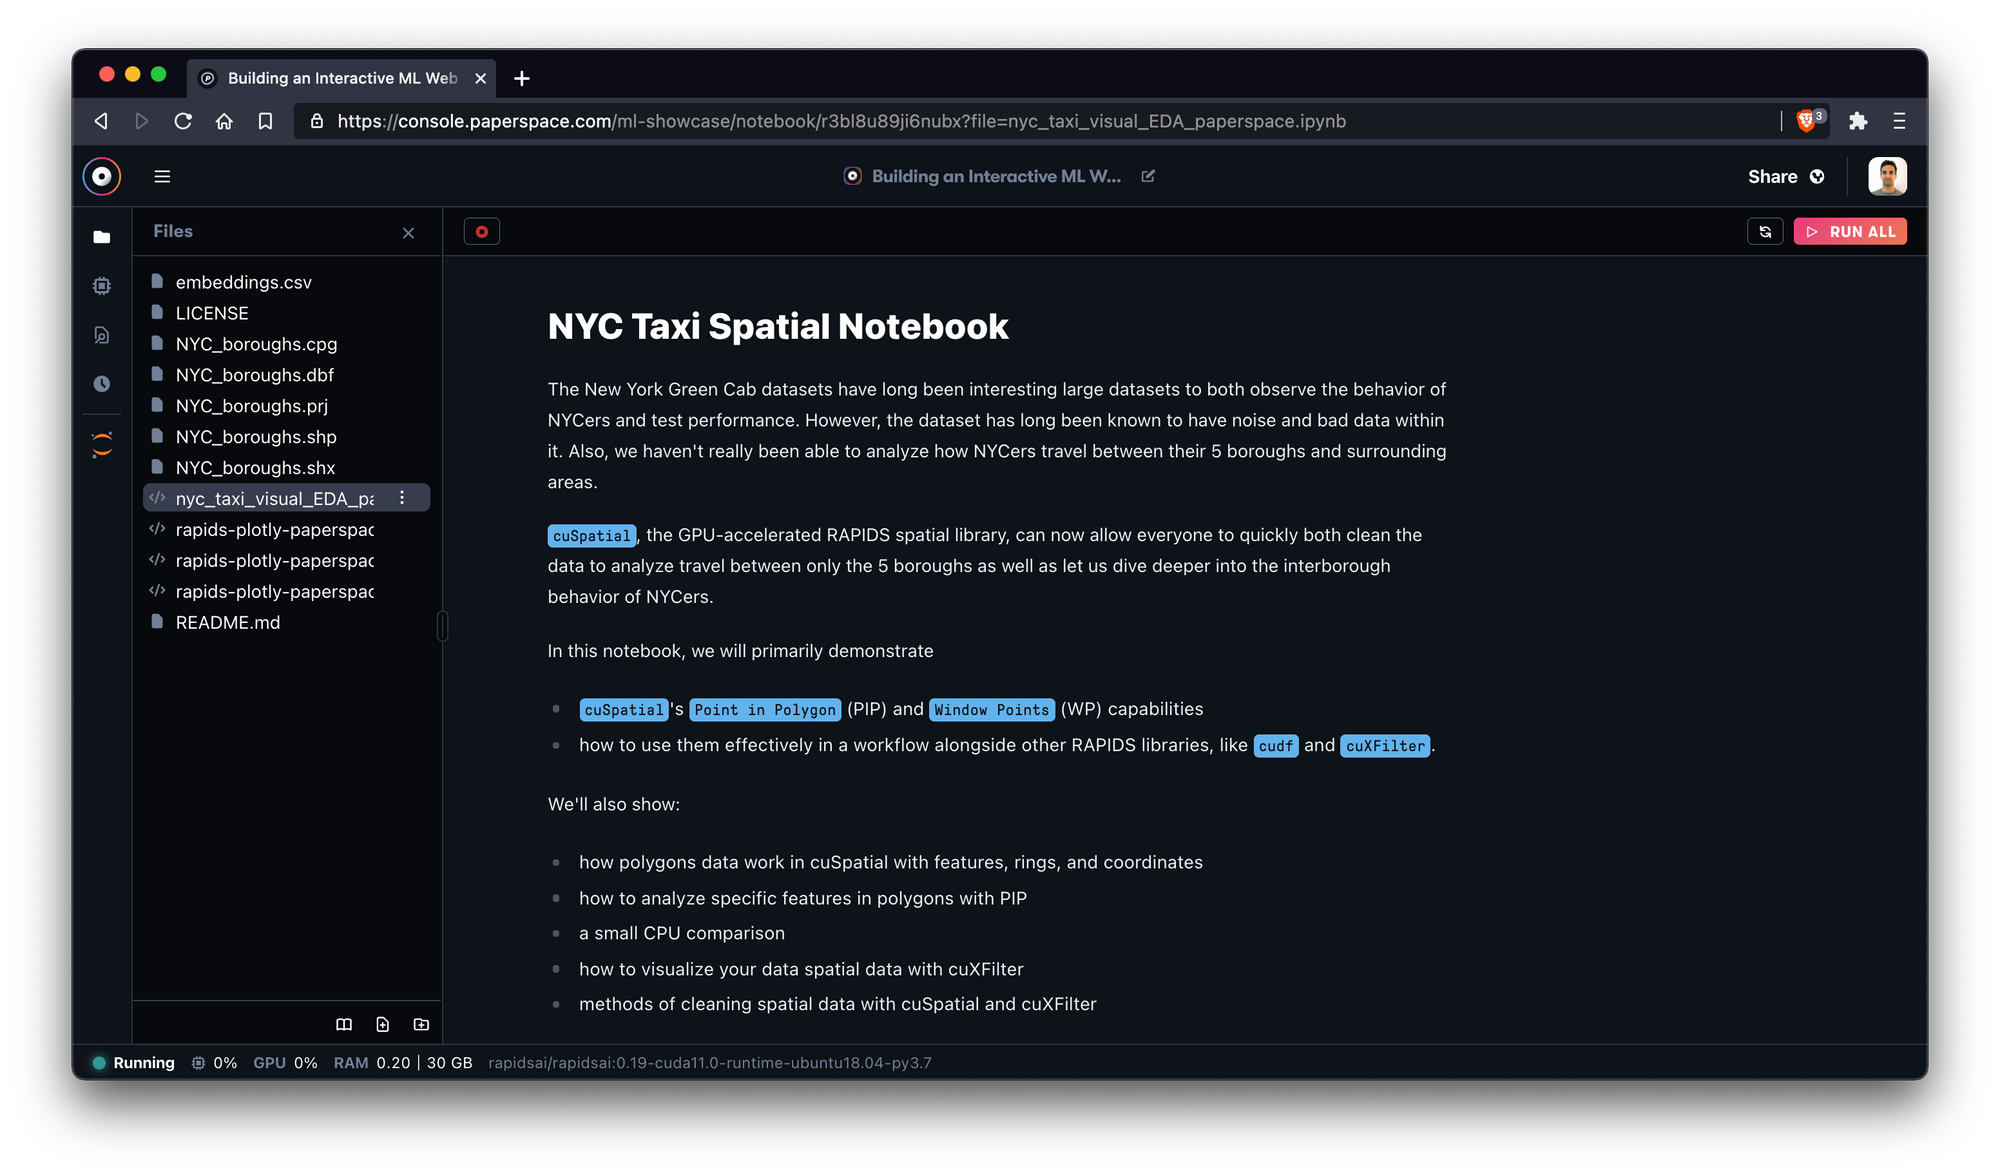
This notebook uses data from the 2015 Green Taxi dataset via NYC OpenData as well as the following libraries:
- cuSpatial - a GPU-accelerated spatial library from RAPIDS
- cuDF - a GPU DataFrame Library also from RAPIDS
- cuXFilter - a framework to connect web visualizations to GPU-accelerated crossfiltering
The notebook primarily utilizes cuSpatial to clean and analyze interborough data and cuXFilter to visualize this data.
Along the way the notebook establishes an endpoint via proxy server to host a realtime visualization! Make sure to make note of your URL schema at the beginning of the notebook in the cell labeled Add notebook ports.
Rapids + Plotly Dash on Paperspace Tutorials 1-3
If you enjoyed working with the NYC taxi spatial notebook, we recommend taking a look at the remaining QTY 3 tutorial .ipynb files, which feature additional RAPIDS libraries and Dash capabilities.
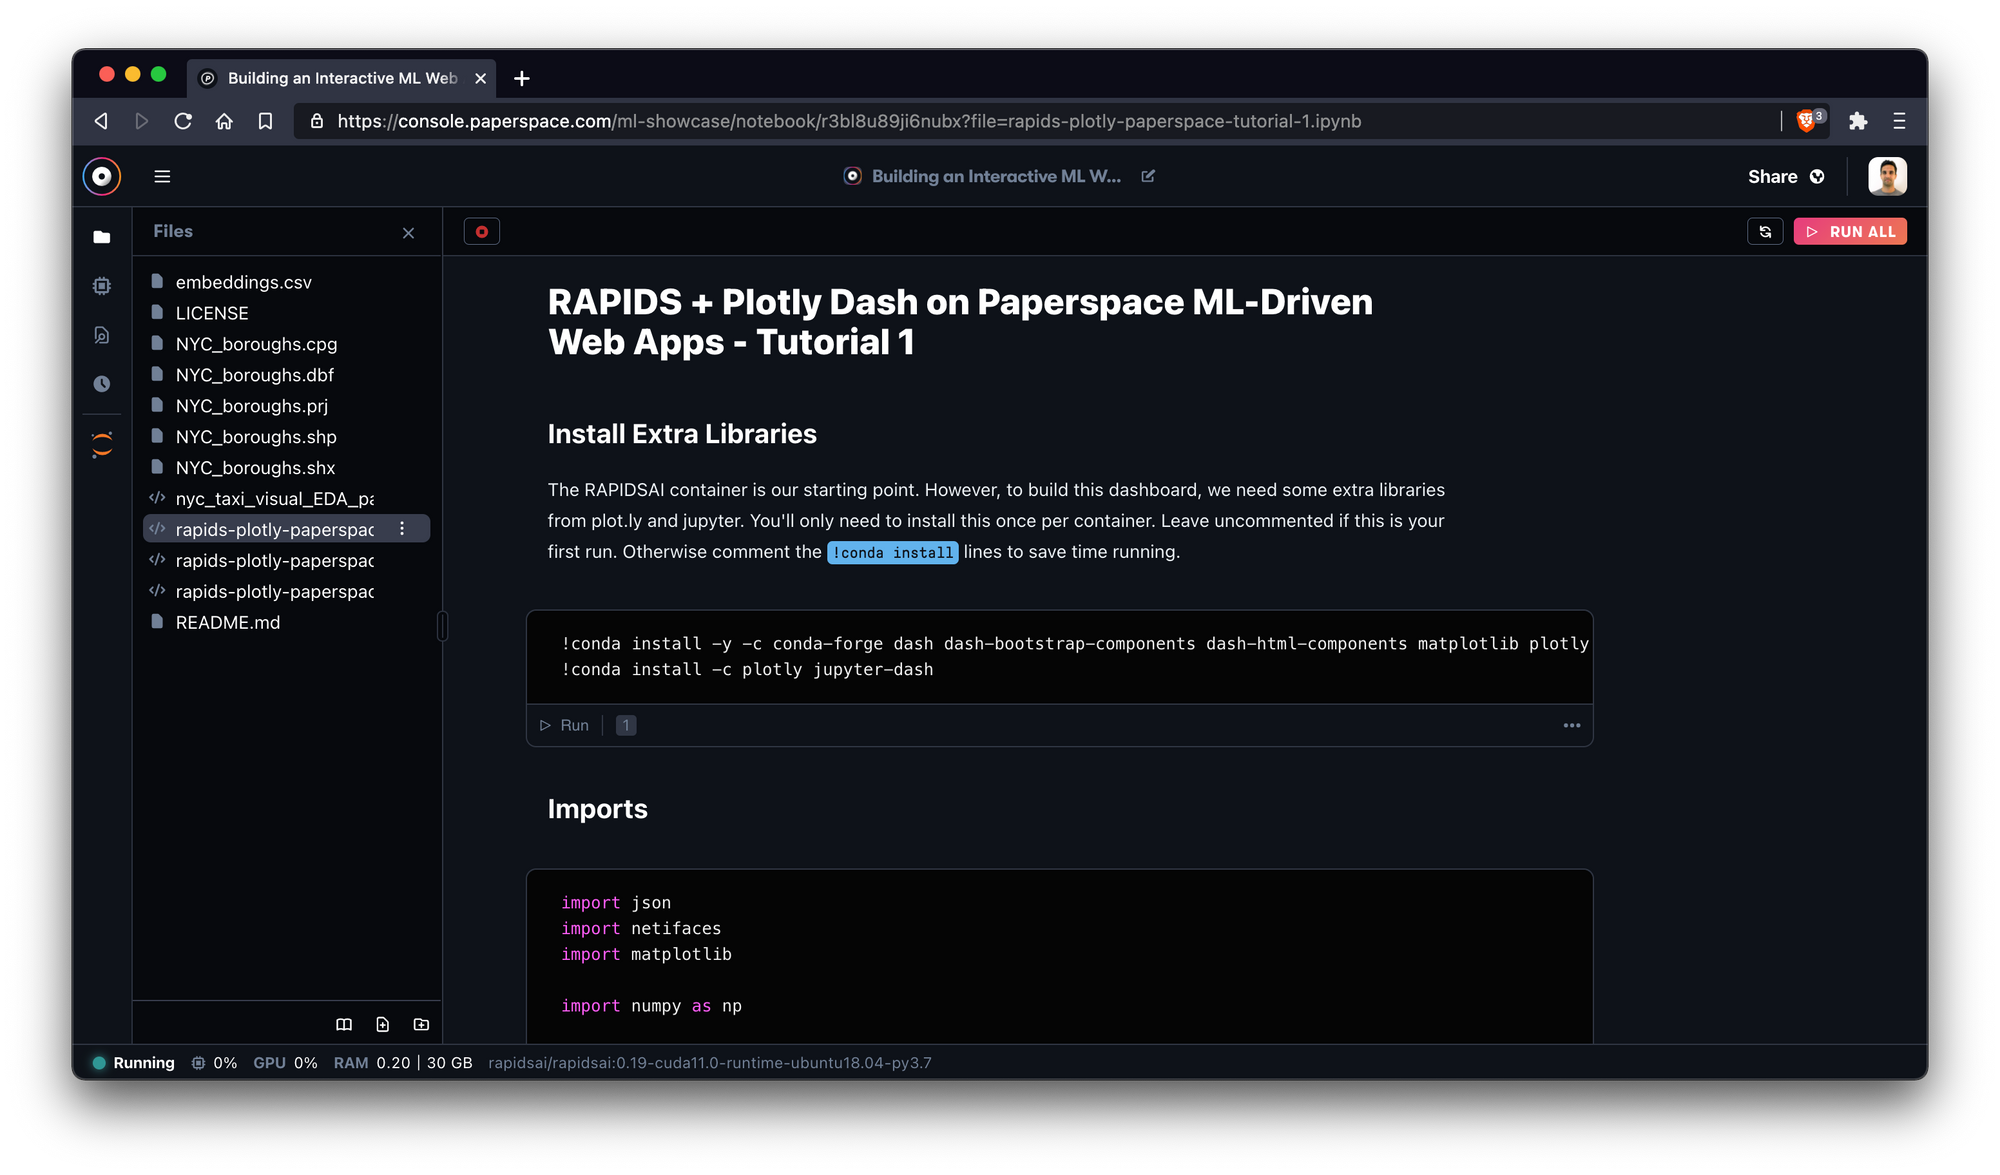
In Tutorial #1, we'll use Dash, cuDF, and cuxfilter to analyze 65K+ cells and their gene expressions. Tutorials #2 and #3 show additional methods of clustering and visualizing data.
Each notebook is self-contained so don't worry about doing them in order. Be sure to reach out to us or to the NVIDIA RAPIDS team if you have any questions or comments.
Additional resources
If you enjoyed working with these notebooks, we invite you to explore other ML Showcase notebooks. We'd also recommend checking in with the Tutorial section of the Paperspace blog periodically for new entries which are added regularly.
Finally, if you'd like to start a new project with RAPIDS, you can simply create a new notebook in the Paperspace console and get started there.
We can't wait to see what you build!


