Introduction
Many of us currently feel trapped inside the confines of their homes, stuck between four walls and afraid to venture out into open spaces to avoid the spread of COVID-19. It is a new disease that has swept the entire world and has rapidly affected many of us.
To fight this pandemic, it is important to filter through misinformation, to understand the limitations of the data we have, and to understand the accepted models for simulating different epidemiological scenarios and the predictions they make. World leaders hold a great responsibility today and bad decisions made by them are capable of breaking national economies, killing many and destroying the lives of others.
This article will look at exactly what we are dealing with when we talk about the coronavirus, what sort of epidemiological and bioinformatic data we have at our disposal, the inferences we can safely draw from such data, and what kind of inferences we ought to stay away from. We also discuss not only what data scientists or virologists have been up to and what policy makers and public health professionals can do in this situation, but also how every citizen can help by spreading the right knowledge, taking care of their loved ones and avoiding all the ways this pandemic can spread further.
Specifically, we will look at:
- SARS-CoV-2 and viruses similar to it
- A primer on important epidemiological concepts
- Understanding the exponential growth of the pandemic
- Data sources on the coronavirus crisis
- Data sources on viral sequence data
- Analysis on what works and what doesn't during a crisis
- Testing kits, vaccines and cures
- Mitigation strategies for people as well as organisations
For those who are interested in skipping over the biological detail and getting straight to the data, feel free to jump right into the section on coronavirus data.
Bring this project to life
Introduction to Viruses
Viruses are nanometer-scale entities on the cusp of being non-linving, yet somehow alive. They usually are comprised of genetic material (DNA or RNA) in a protein/lipid coat. They replicate by attaching to plant or animal cells and inserting their genetic material into the cell. The genetic material is initially translated by the host cell machinery, which creates proteins and more copies of the viral genetic material. The new viral material is then packaged into the newly produced protein coat, which are released when the cell is killed by the unsustainable reproduction of the virus.
Viruses recognize particular proteins on the host cell surface to bind to, and force the cell to uptake the viral material. Many cell surface proteins are similar across related species; this allows viruses to cross into new species when they mutate. Many viruses that we humans face have originated from other animals. Luckily, viruses tend to grow less harmful to the host as time passes. This is because the virus would have less time to propagate itself if the host died quickly. Viruses are generally most dangerous as they jump species, since they are equilibrated to the previous species. Most human viruses are relatively harmless in their source species. The common sources are livestock, bats and simians.
Viruses Similar to SARS-CoV-2
Severe Acute Respiratory Syndrome (SARS-CoV-1)
SARS, or Severe Acute Respiratory Syndrome, first emerged in China in November 2002 as atypical pneumonia. It started showing up in other regions of China by January. In late February 2003, a person who was caring for an infected individual stayed at a hotel in Hong Kong and infected 16 other guests in 24 hours. This event led to global spread of the disease. It ended by July 2013 with 8096 infected and 774 dead. Factors that helped bring the SARS-1 outbreak under control, but unfortunately aren't helpful for the SARS-CoV-2 outbreak, were that SARS-1 was infectious only after symptoms were visible. It also had a more consistent set of symptoms, unlike COVID-19 which can transmit long before symptoms show and the symptoms themselves can be inconsistent.
Middle-East Respiratory Syndrome (MERS-CoV)
MERS was a disease caused by a coronavirus first identified in Saudi Arabia in September 2012. The common symptoms of MERS were fever, cough, shortness of breath and often pneumonia. MERS had a high mortality rate of around 35%, but did not easily transmit between people unless they were in very close contact. The original source of MERS-CoV were camels, but the exact route of transmission from animal to humans is not understood. MERS infected a total of 2,494 individuals of which 858 died across 27 countries.
H1N1 Influenza Pandemic
The 1918 H1N1 influenza pandemic was the last pandemic humanity faced on the scale of the current ongoing COVID-19 pandemic. The virus originated in the USA (possibly Kansas) and spread due to the large scale migration of troops during World War I. Since there were no vaccines or treatments known, combined with a lack of communication between countries during wartime, the consequences were dire. Within two years the death toll reached over 40 million worldwide with 10-12 million deaths in India alone. The current global trajectory of COVID-19 leads to an outcome better than H1N1, and this is entirely due to the prompt response and recent advances in technology.
Introduction to Epidemiology
According to the Dictionary of Epidemiology, Epidemiology is the study of the distribution and determinants of health-related states or events in specified populations. The application of this study is to control health problems. The word arises from the Greek phrases epi, meaning upon; demos, meaning people; and logos, meaning the study of what befalls a population. The field of epidemiology concerns itself with frequencies and patterns that a population might face due to a health-related calamity. While patterns would include the mortality statistics with respect to time, age, region, gender, and so on, the frequency-related statistics would be related to the mortality statistics in relation to the size of the population. By understanding how a disease spreads, it is possible to narrow down the causes of a disease on a sociological level and help decision makers develop and implement effective mitigation strategies.
Endemics, Epidemics and Pandemics
Epidemiology categorizes diseases that affect a certain set of population by scale, and their prevalence in a geographical area.
Endemics: A particular disease that has persisted in a population for a very long time. These diseases have a stable incidence rate and are geographically contained. Malaria, which is a life-threatening but curable disease caused by parasites that are transmitted to people through the bites of infected female Anopheles mosquitoes, is considered endemic in sub-Saharan Africa but not in the UK. The WHO regions of South-East Asia, Eastern Mediterranean, Western Pacific, and the Americas are also at risk.
Epidemics: When an endemic disease, often suddenly, spreads outside its normal region or increases in frequency in the population much faster than expected, it is referred to as an Epidemic. An example is the typhoid fever epidemic in New York (1906-1907). Mary Mallon, often referred to as “Typhoid Mary,” spread the virus to about 122 New Yorkers during her time as a cook on an estate and in a hospital unit. That year, 10,771 people passed away from typhoid fever (although these stats vary according to different sources, like this one which claims that only 3,000 and not 10,771 died in 1907).
Pandemics: A pandemic is an epidemic that spread across countries and continents, for example the HIV/AIDS pandemic, the global incidence of which, according to a report published in The Lancet, peaked in 1997 at 3.3 million per year. Often epidemics are caused by viruses like HIV, measles or influenza and are spread via carriers (like animals or humans) at which point they become pandemics.
Exponential Spread of Pandemics
In epidemiology there is a need to quantify the severity of outbreaks. SEIR Models and RO are the most widely accepted models for such a quantification. The standard procedure to achieve this by calculating the basic reproduction number: R0. R0 is defined as the average number of secondary infections caused by a single infected individual during the entire infectious period at the start of an outbreak. If R0 < 1 then each person on average infects less than one person and the infection dies out over time. If R0 > 1 then the epidemic follows a logistic growth, growing exponentially at first till most people are infected at which point the total number of cases starts to flatline.

The appropriate basic epidemiological model for COVID-19 is the SEIR model. This model is based on Susceptible individuals who are not yet exposed to the virus, Exposed but asymptomatic individuals who are infected but not yet transmitting the virus, Infected individuals who are symptomatic and transmitting the virus, and Removed individuals who have recovered or died from the infection. Individuals pass through the stages in the order mentioned previously.

The rate equation from one state to the other can be represented as a first order differential equation as follows:
d(S)/dt˙ = −βSI + λ − µS
d(E)/dt˙ = βSI − (µ + k)E
d(I)/dt = kE − (γ + µ)I
d(R)/dt˙ = γI − µR
Where β is the effective contact rate, λ the birth rate , µ the mortality rate, k is the progression rate from Exposed to Infected, and γ is the removal rate. For modelling COVID-19, λ and µ can be safely set to zero. The progression rate k is the inverse of the average rate of incubation for individuals. Removal rate is the inverse of a weighted average of recovery time and time until death.
In such a model, the R0 is:

Details of a SARS-CoV-2 specific model can be found in the appendix of the paper here. A python notebook implementation of the SEIR model can be found here.
A great tool is the epidemic calculator by Gabriel Goh, which lets you play around with different numbers that affect the transmission dynamics according to the SEIR model above and understand the effects on a population (according to when intervention begins). Some great analysis was done in a series by Tomas Pueyo, the second part of which determines what would be the outcome for the US if nothing was done throughout the epidemic spread. The graph can be seen below.

The source code can be found here.
Another amazing article that gives us visualizations of how an epidemic spreads can be found in this Washington Post article. The author designs simulations for several scenarios where people (shown as dots) are moving about freely, are forced to be under quarantine, are abiding by social distancing measures, etc. The visualizations make understanding the spread of an epidemic much more intuitive. One of the visualizations of how quarantining the infected patients affects the population can be seen below.
Another interesting simulation in the same article shows the effect of social distancing on a population: what happens when only an eighth of a population is allowed to move.
COVID-19
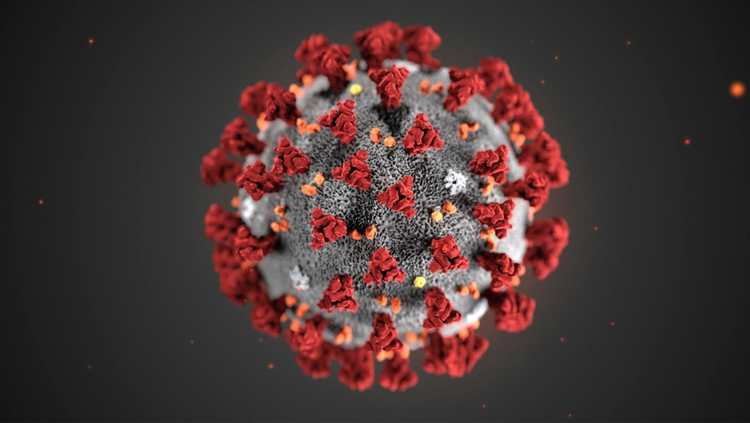
The disease COVID-19 is caused by the SARS-CoV-2 virus which is a betacoronavirus of size between 60-140nm. Coronaviruses normally cause 20% of the common cold, with MERS and SARS being the known instances of serious infections. The virus infecting humans appears to be either from bats or pangolins, and shares roughly the same amount of similarity to the naturally circulating coronaviruses in both animals. The major source of the initial outbreak was the Wuhan Seafood Market, but whether the virus originated here is speculated but unconfirmed. It was first noticed as a novel non-bacterial pneumonia because of the spike in pneumonia-related deaths by mid December. Only on December 30th was the causative agent identified as a corona virus.
Similar to SARS-CoV-1, the virus enters the host cell using the Spike Protein(s) present on the viral coat. This protein attaches to the Human ACE2 receptor, which facilitates the fusion of the viral and human cell membranes and the insertion of the viral genome into the cytoplasm of the human cell.
The major clinical symptoms are fever, cough, muscular soreness and dyspnea though these are not consistent between people. Recent studies also show that a sizable portion of infected individuals show no symptoms. In severe cases the disease progressed to the development of ARDS (Acute Respiratory Distress Syndrome), Arrhythmia (irregular heartbeat), and organ failure (lungs/heart/kidney).
The Coronavirus Crisis
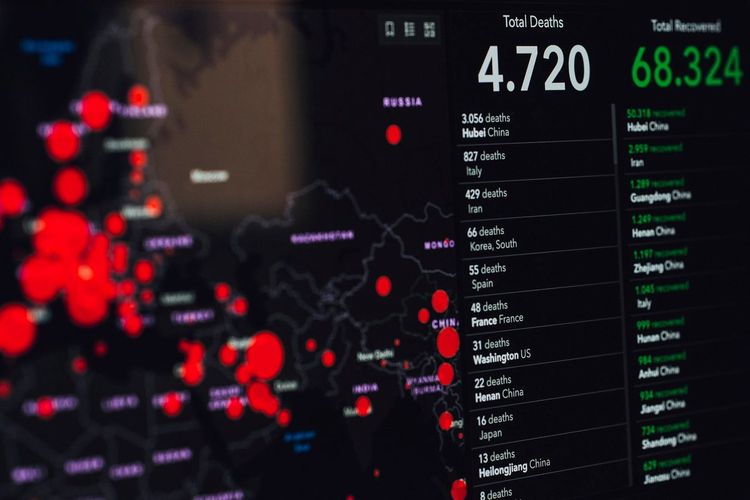
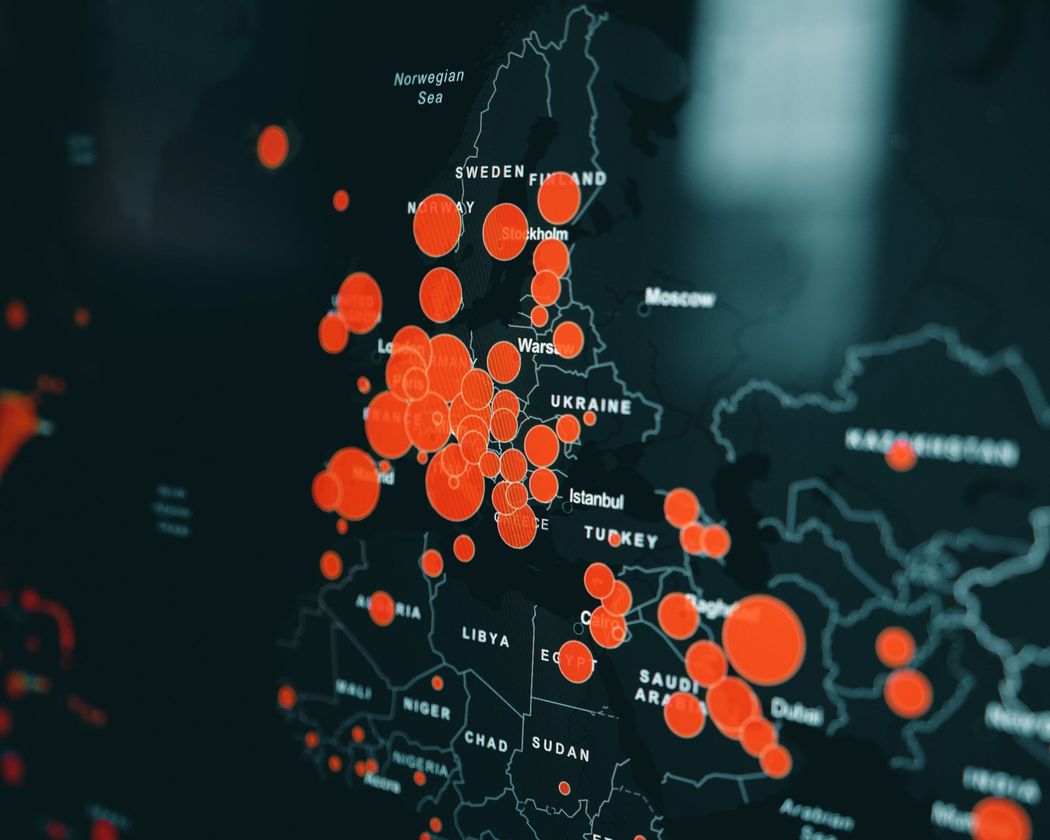
As of April 20th, 2020, the new coronavirus has reached at least 180 countries, infected more that 2.4 million people and killed more than 166,000 people world-wide. Europe has been hit the hardest so far. Italy has the highest number of deaths from COVID-19, followed by Spain, France and UK. Other countries that have been severely affected by this crisis include Iran, US, Germany and Turkey. In response to the crisis and several countries failing to measure up to the threat of the virus, India announced a complete lockdown and recently extended it till 3rd May.
As an effort to make research more accessible and filter through misinformation, we will attempt to gather as many different data sources and the different initiatives taken to solve the crisis.
Data on the Coronavirus Crisis
There are several resources that you can use to gather data on death counts, the number of infected people, and the number of recoveries tabulated according to different countries, areas, and time that has passed.
Tracking the spread of the virus, identifying at-risk areas, and implementing preventive measures accordingly are a few things that can be done with the data.
Here are a few sources that are constantly updating their data on the crisis.
John Hopkins
The Johns Hopkins University Center for Systems Science and Engineering (JHU CSSE) maintains a web-based dashboard that tracks the different numbers mentioned above, and displays them on an interactive map. The numbers are also available specifically for different countries and provinces in different countries. Some interesting plots of the deaths and infections depicting exponential growth can also be found. The data collected for the project is openly sourced for anyone to access, and can be found here. They confirm their statistics from several different government organizations before updating the dashboard, including the WHO, China CDC, The Government of Canada, etc. More information about the effort can be found in this blog post. You can check out the live dashboard here.

Woldometer
Worldometer also collects and regularly updates a count of active cases, critical cases, and deaths. There are several static plots and snippets of research on the incubation period of the virus, and case graphs of newly infected vs newly recovered cases, which could be helpful in determining the inflection point of the epidemic. Anyone interested in looking into how the data we have on COVID-19 is similar to the 2003 SARS crisis can find the WHO data on the SARS pandemic here.

Data Analysis
Many articles have come out which plot the number of deaths, recoveries, etc. in different countries. Several dashboards (as mentioned above) provide great visualizations of what the current state of the world is with respect to this pandemic–in numbers and statistics, graphs, pie charts, maps, heat maps, etc. We therefore won't be concerning ourselves with these analyses in this article.
Some great data analysis was done in articles like this two-part series by Tomas Pueyo (published on March 10th and 20th). There are over 30 translations of the first part. One of the more important charts from the first part of the series (displayed below) describes the timeline of events related to the coronavirus in Hubei, China.

The orange bars display the cases diagnosed, and the grey bars show the actual number of infected. The true cases could only be found looking backwards, and determining when the symptoms began for those diagnosed. Pueyo states in this article:
“What this means is that the orange bars show you what authorities knew, and the grey ones what was really happening…”
The number of diagnosed cases rapidly increases after the lockdown for some time, and starts decreasing soon after, while the number of actual coronavirus cases rapidly decreases after the lockdown.
“If you stack up the orange bars until 1/22, you get 444 cases. Now add up all the grey bars. They add up to ~12,000 cases. So when Wuhan thought it had 444 cases, it had 27 times more. If France thinks it has 1,400 cases, it might well have tens of thousands.”
The number of diagnosed cases rapidly increases and then starts to decrease only as the medical facilities in a region ramp up their healthcare facilities, along with a quarantine that is imposed strongly enough to identify new cases immediately and avoid exposing the virus to the non-infected population. He also mentions in the article:
“Up until Jan 23rd, when Wuhan closes, you can look at the grey graph: it’s growing exponentially. True cases were exploding. As soon as Wuhan shuts down, cases slow down. On Jan 24th, when another 15 cities shut down, the number of true cases (again, grey) grinds to a halt.”
He also highlights the case of South Korea, where the virus was contained for the first thirty days until one patient passed it on to thousands of others. While their containment effort can be clearly seen in their spread counts, they are still paying for that one slip-up.
Viral Sequence
GISAID (the Global Initiative on Sharing All Influenza Data) is leading a large scale effort to share genomic sequences of COVID-19 from several different countries to make it easier for independent researchers and organizations to understand the virus better, and hopefully develop a vaccine. The data includes sequences from China, Hungary, Australia, and Vietnam, among others. Based on this data, Nexstrain has created an interactive dashboard that lets you visualize the spread of COVID-19 with respect to time and geography, along with the genomic sequences submitted to or gathered by GISAID. Keep in mind that the high mutation rate seen in the ORF1b and S gene were also seen in SARS-CoV-1, but they had no observable effect and are likely examples of neutral mutation.

You can hover over different data points and find the nucleotide mutations, divergence, and other interesting data analysis. You can also read their latest situation report here where they analyse 723 publicly shared COVID-19 genomes. You can see the scripts for the analysis on their GitHub and learn about how to read phylogenetic trees from this narrative.
Similar to GISAID, the China National Center for Bioinformation has been collecting genomic sequences of different coronaviruses. These sequences are available for download to anyone who is interested. The quality of the sequences is also mentioned in the downloads section. The data has been analyzed for genotyping map visualizations, Bayesian phylogenetic trees, and variation frequency heat maps, among other things. More sequence data is available on the NCBI SARS-Cov-2 sequences page.
The virus has a size of 30 KB, meaning it is made up of 30,000 RNA nucleotides (A/U/G/C). Since it is a virus made of RNA, it shows a higher rate of mutation (a letter changing into another). This is normal and there is no evidence that these changes lead to any observable effects in clinical outcome. It is useful, however, for tracing infections, since once a mutation occurs, it will be visible in all progeny of the virus and thus further infections.
Testing Kits, Vaccines and Cures
While looking at standard testing strategies, two important technologies exist. PCR (Polymerase Chain Reaction) is a DNA amplification technique used to convert small quantities of DNA into large quantities of DNA to make analysis possible. Combined with a fluorescent dye, PCR can tell scientists how much DNA there is, which is useful in determining whether a pathogen has infected someone or not.
The SARS-Cov-2 genome is made out of a single-stranded RNA, which has to be converted into a DNA for PCR to work. This is done with the help of an enzyme called reverse-transcriptase. Combining the two techniques we get RT-PCR, which is the currently available method to test for COVID-19. The test itself only takes about a day to run if you have all the required reagents. The sample is collected from the back of the patient's throat or nose, shipped to a testing lab, and prepared for testing by first separating the RNA from all the other things–proteins, cells, and enzymes–using a process called RNA extraction. Once that is done, the RNA is converted into DNA using reverse-transcriptase, and the DNA of the virus is amplified with PCR using nucleotides and primers that will bind to the specific segments of the viral genome. If all goes right, it will only amplify the fragments of DNA that contain the virus and nothing else. All of this happens in the PCR machine which only trained individuals with Biosafety Level 3 (and more recently, BSL2) clearance can operate, and is available at several universities and research labs. The WHO laboratory testing guidance documents can be found here.
The RT-PCR tests are a general method for testing of pathogens and require protocols for different infections and diseases; what RNA extraction methods to use, which PCR machine to use, and which primers. The WHO recommended protocol for COVID-19 includes testing using four primers: two of which target regions of the SARS-Cov-2 genome that help create a protein that encapsulates and protects the virus, one which targets the whole SARS-like viruses, and a 4th which targets the human genome and acts as a positive quality control.
Antibody test kits, on the other hand, detect antibodies produced by the body in response to the disease. This can detect people who have recovered from the infection since the antibodies persist for several weeks after recovery. This cannot be used for diagnostics as it takes 7-10 days post-infection for the body to produce antibodies at detectable levels, but can be used to estimate the asymptomatic spread of the disease. Another advantage of these tests is that they return results in under half an hour.
There are currently two vaccines undergoing clinical trials, and another 52 awaiting approval for clinical trials. Of the two currently in clinical trials, the LNP-encapsulated mRNA is a novel method of vaccination which works by injecting mRNA encoding the viral protein, which is then picked up by the immune system.
The promising candidates for treatment of COVID-19 are currently being trialed by the WHO in a massive study called SOLIDARITY. The four treatments repurposed from other diseases and currently being tested are:
- Ritonavir/lopinavir, which were anti-HIV drugs
- Remdesivir, which was an anti-Ebola drug that was abandoned when monoclonal antibodies were found
- Chloroquine and hydroxychloroquine, which are out-of-patent anti-malarial drugs
- Ritonavir/lopinavir with interferon-beta
Mitigation
There are several things that have to work together to control a pandemic, which includes accelerated and aggressive testing and tracing, case isolation and quarantine, social distancing and awareness about how the virus spreads and what every household can do to maximize the safety of their loved ones.
Hygiene and seeking medical care
The WHO guidelines for the public urge populations to collectively commit to certain hygienic standards and take care that they are reducing the risk of contracting the virus for themselves, as well as others around them.
It is advised that everyone should:
- Wash their hands frequently to kill the viruses and pathogens that maybe on your hands.
- Avoid touching the eyes, nose, and mouth, since once contaminated, your hands can transfer the virus to your lungs through your respiratory tract, increasing the risk of infection.
- Practice respiratory hygiene; cover your mouth or nose while coughing or sneezing to reduce the chances of spreading the disease to someone else.
- Avoid touching surfaces. The virus has a tendency to stay on surfaces anywhere between a few hours to a few days, depending on the type of surface. If you do, immediately wash your hands.
- Seek medical help early if you catch a fever, cough, or have difficulty breathing, to avoid risking your own life and the lives of others. This will also help national authorities get a clearer picture of what the situation in your area is like so they can design mitigation strategies accordingly.
Aggressive testing and contact tracing
The best way to combat the infection is through aggressive repeated testing of all known and suspected cases and their contacts, as seen in the South Korean response. Only when you are aware of the cases can you effectively prevent its spread by isolating and quarantining patients. Individuals with risk of infection should be tested often, since a person can transmit the disease before showing symptoms. This is reflected by WHO communication summarized as "test, test, test".

Wearing Masks
The efficacy of wearing masks has been a contentious topic of debate recently. Some advocates were falsely attributing the success of South Korea, Japan and Singapore's response to COVID-19 as the effect of masks. There is evidence that wearing masks can reduce the risk of others getting infected when an infected individual is wearing them. If you have any symptoms of COVID-19 it is highly recommended you wear a mask. Current WHO guidelines do not recommend people without symptoms wearing masks but many countries are implementing policies that require masks to be worn when outside. The WHO guidelines were initially to prevent shortages of masks for healthcare workers and other essential staff in high risk environments. Wearing homemade masks or normal masks when ample supplies are available is encouraged. N95 masks should however only be worn by people in high risk environments or immunocompromised individuals and not by the general public.
There is the issue of people feeling protected and compensating with riskier behaviour. Even while wearing masks one should always prioritize maintaining physical distance and avoiding contact with the face or the mask. Care has to be taken when removing the mask so as to not touch the outer regions and washing hands immediately after taking the masks off. Masks should not be worn for extended periods of time. Surgical masks should be disposed of in a closed bin immediately after taking it off. Reusable masks should be washed with detergent after every use.
Quarantine and social distancing
While looking into mitigation strategies, the Pueyo article mentioned the need for ICU beds in the UK for different kinds of social distancing measures.

It is clearly seen in the graph the effect of social distancing: the onset of the peak is delayed as the measures are more stringent, along with a lowered peak in general. This gives us less deaths, and more time to ramp up our healthcare systems while lowering the chances of the healthcare systems getting overloaded and collapsing. Another hidden benefit of having a not-overburdened healthcare system is that infections spreading to nurses, public health workers, etc. is lowered as well, which amounts for many of the currently infected.
In countries that are going through a lockdown, people are paranoid that the social distancing measures implemented might get extended not just to a few weeks but to months. Besides the fact that someone advocating such a lockdown is risking a crashing economy for the country, without the right amount of testing facilities deployed with an aggressive rate, the social distancing measures don’t do much but postpone the pandemic. It is possible to not implement a curfew for months on end and still mitigate the crisis.
Conclusion
To sum up the crisis and mitigation strategies, let's have a look at another very important chart from the Tomas Pueyo series.

The chart lists out all the different ways the virus can be suppressed. Looking at countries which have successfully dealt with the virus like Singapore, South Korea and Taiwan, it is clear that appropriate effort driven into detection, isolation, public decontamination, healthcare resources and social distancing can come together to slow down and diminish the impact of the deadly virus. If countries are able to contain the crisis early on, they might not have to close down public and private schools, universities, places of worship, etc. But if measures aren’t taken, countries might be forced to pay with a dwindling economy and closure of several essential services for a long time.
Further Reading
- https://www.ncbi.nlm.nih.gov/books/NBK21523/
- https://www.who.int/emergencies/diseases/novel-coronavirus-2019
- https://meltingasphalt.com/interactive/outbreak/
- https://www.sciencemag.org/news/2020/03/coronavirus-cases-have-dropped-sharply-south-korea-whats-secret-its-success
- https://www.nytimes.com/article/coronavirus-timeline.html