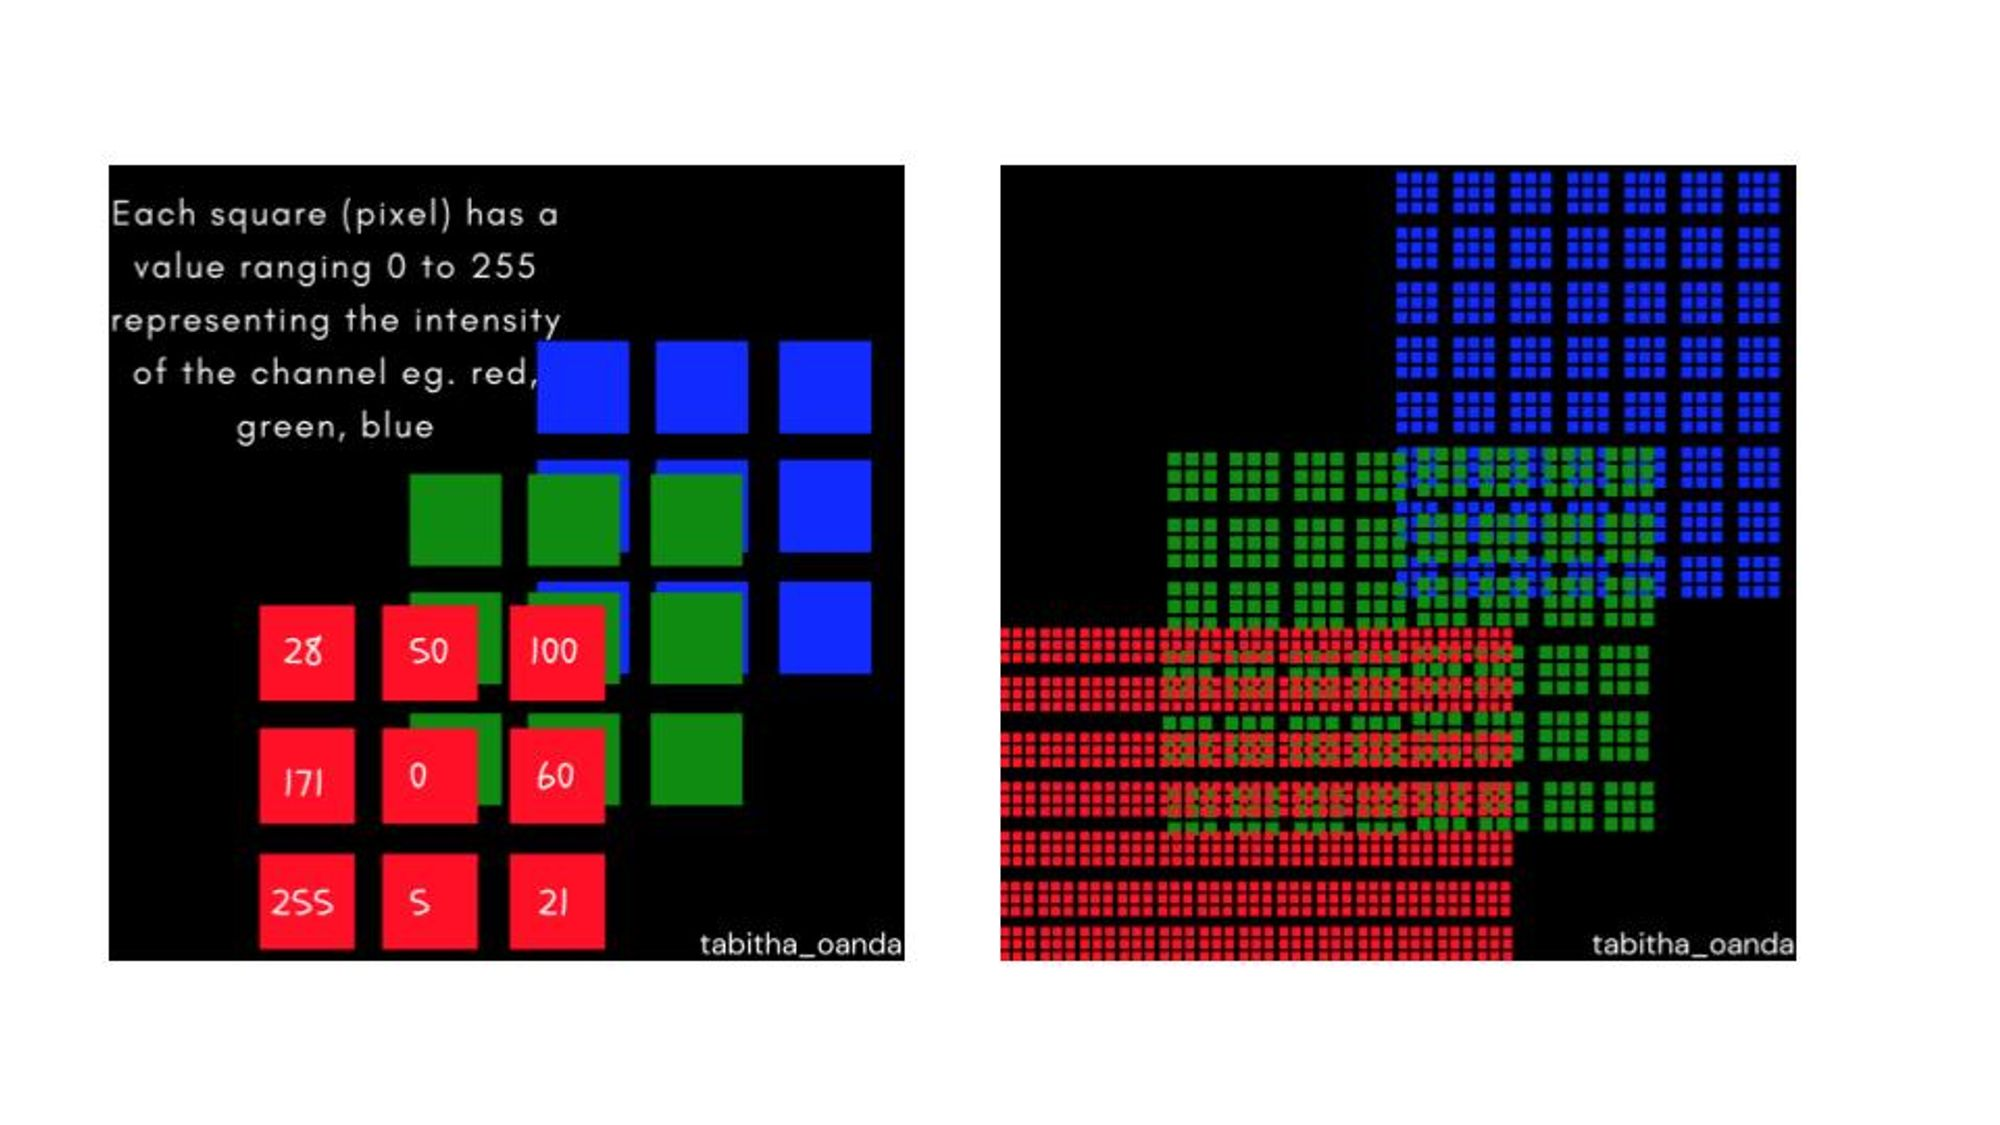
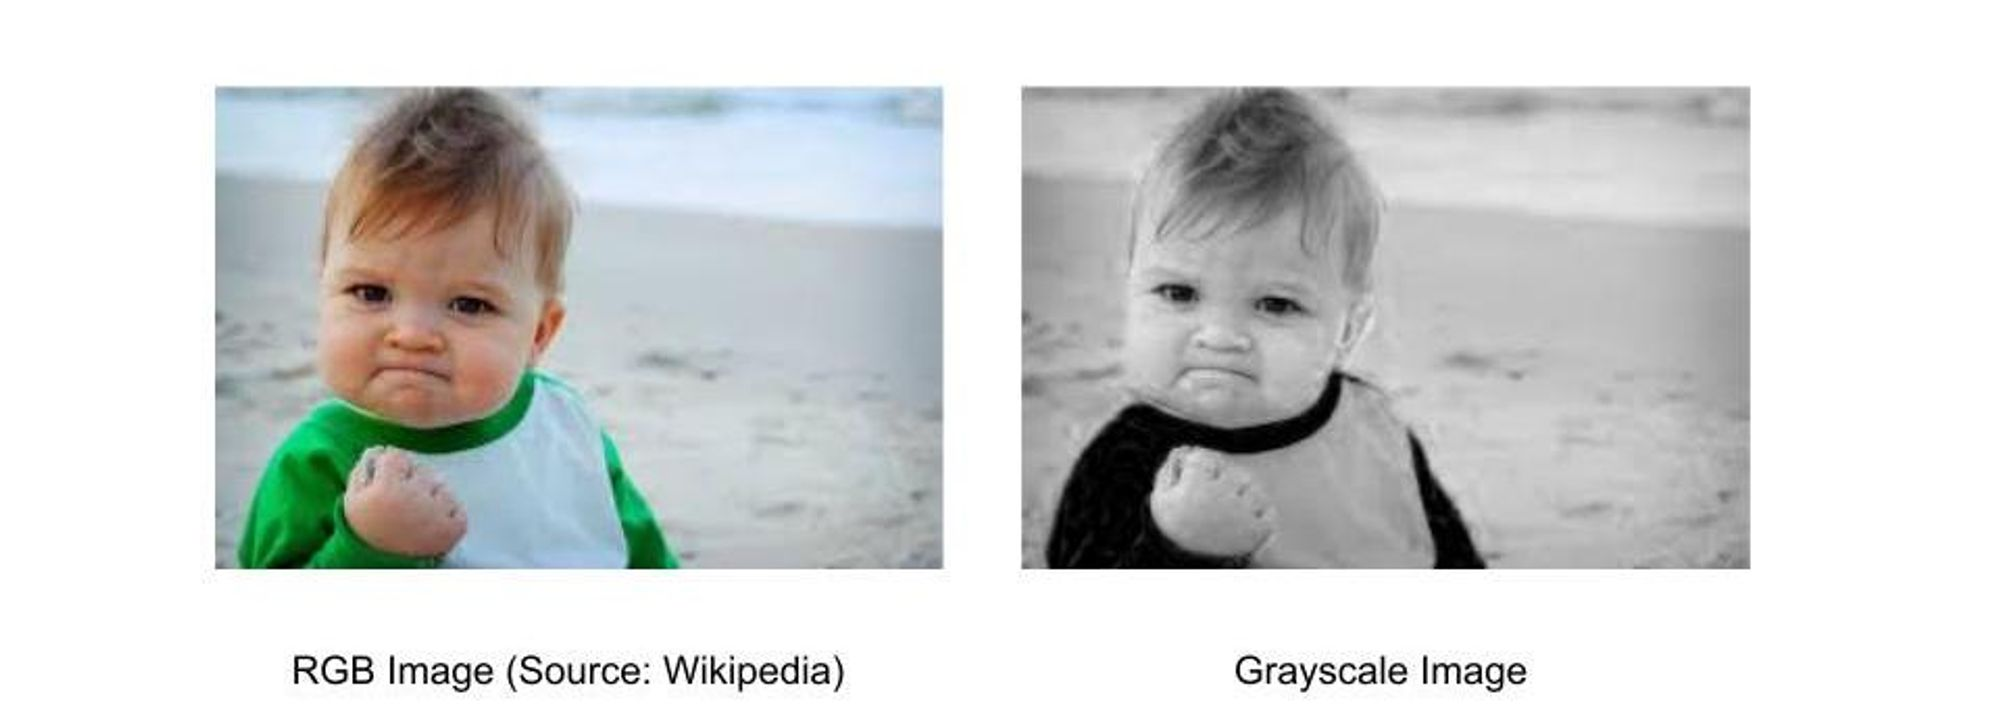
Images are matrices that contain numerical values describing pixels in those coordinates. Colorful images contain 3 color channels red, green, and blue (RGB) which means that the image is represented by 3 matrices that are concatenated. Grayscale images contain a single channel meaning the image is represented by a single matrix.
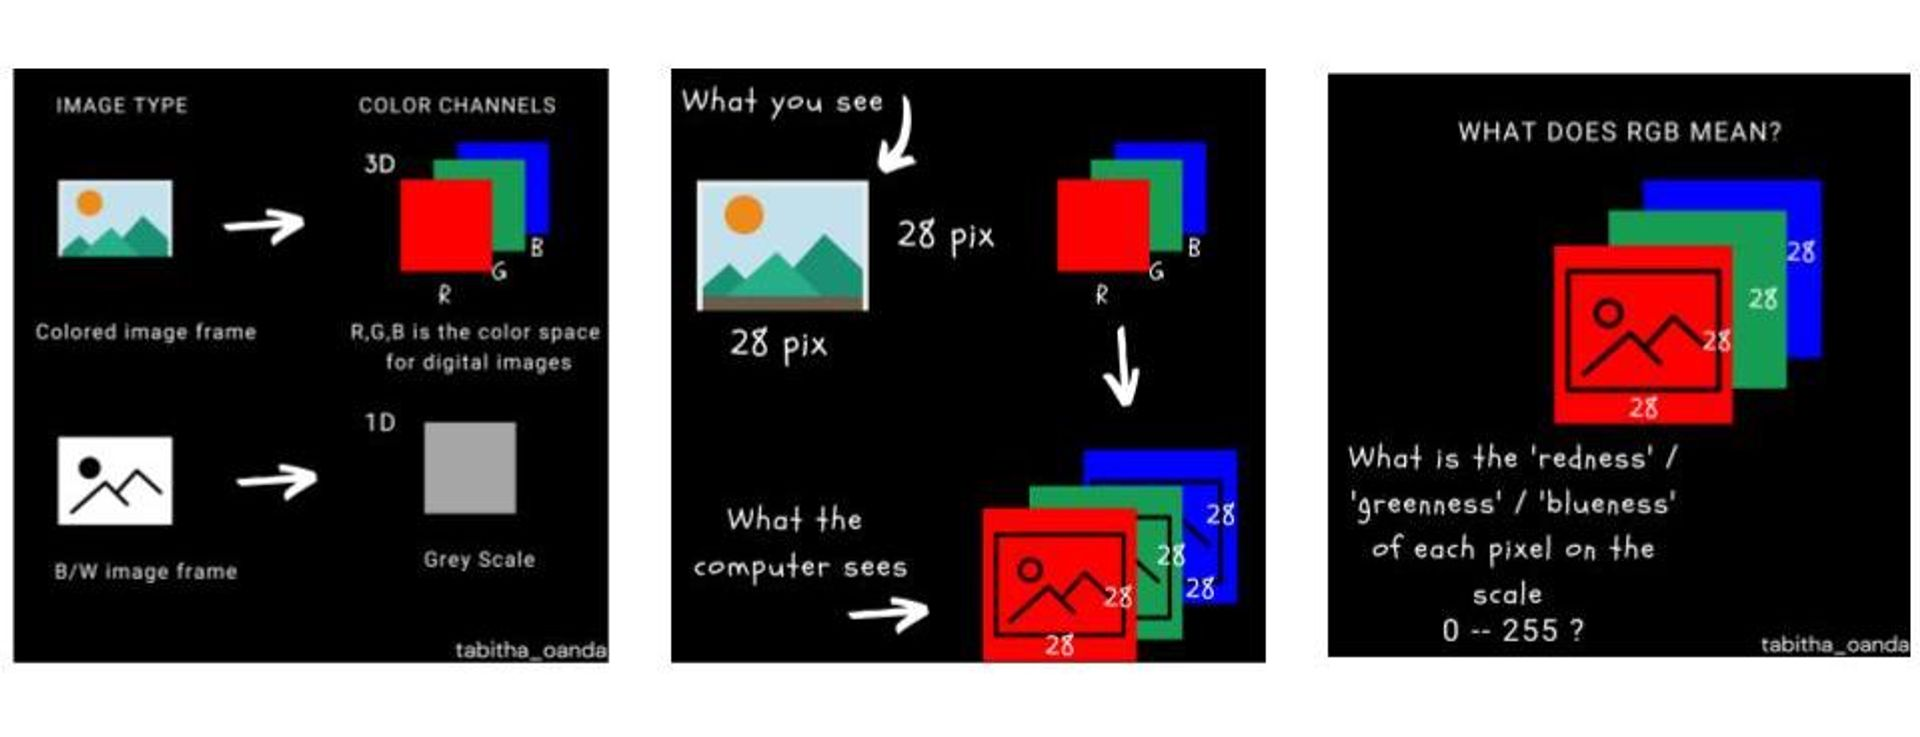
Image representation is a task that involves converting an image matrix (grayscale or RGB) from its normal dimensions into a lower dimension while maintaining the most important features of the image. The reason we want to analyze an image in lower dimensions is that it saves on computation when analyzing the values of the image matrix. While this might not be a strong concern when you have a single image, the need to efficiently compute values comes in when analyzing thousands of images which is often the case in machine learning for computer vision. Here is an example, below in the image on the left, the algorithm analyzes 27 features. In the image in the middle, the algorithm analyzes thousands of images depending on the image dimensions
Besides saving on computing costs, it is important to note that not every aspect of an image is important for its characterization. Here is an example, if you have two images, a black image and a black image with a white dot in the center, finding the differences between these two images is not heavily influenced by the black pixels in the top left of each image.
What are we analyzing in an image?
When we look at a group of images we can easily see similarities and dissimilarities. Some of these are structural (light intensity, blur, spec noise) or conceptual (a picture of a tree vs that of a car). Before we used deep learning algorithms to perform feature extraction independently, there were dedicated tools in computer vision that could be used to analyze image features. The two methods I will highlight are manually designed kernels and Singular Value Decomposition.
Traditional Computer Vision Methods
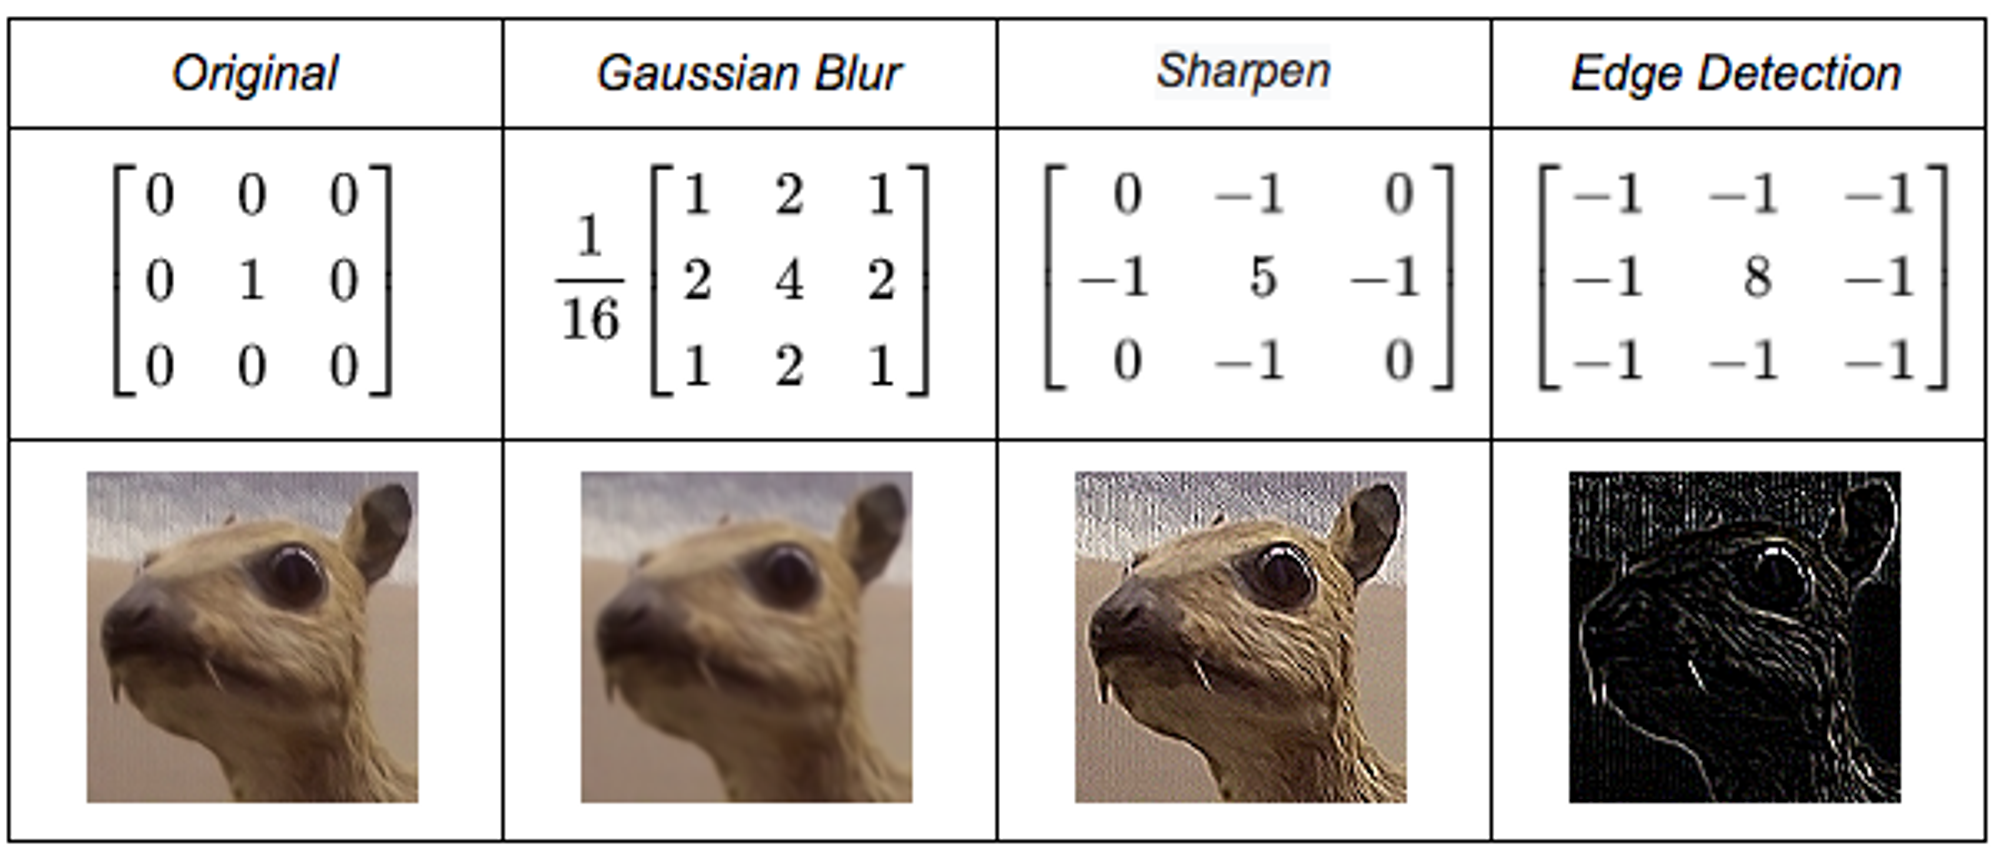
Designing kernels: It involves designing a square matrix of numerical values and then performing a convolution operation on the input images to get the features extracted by the kernel.
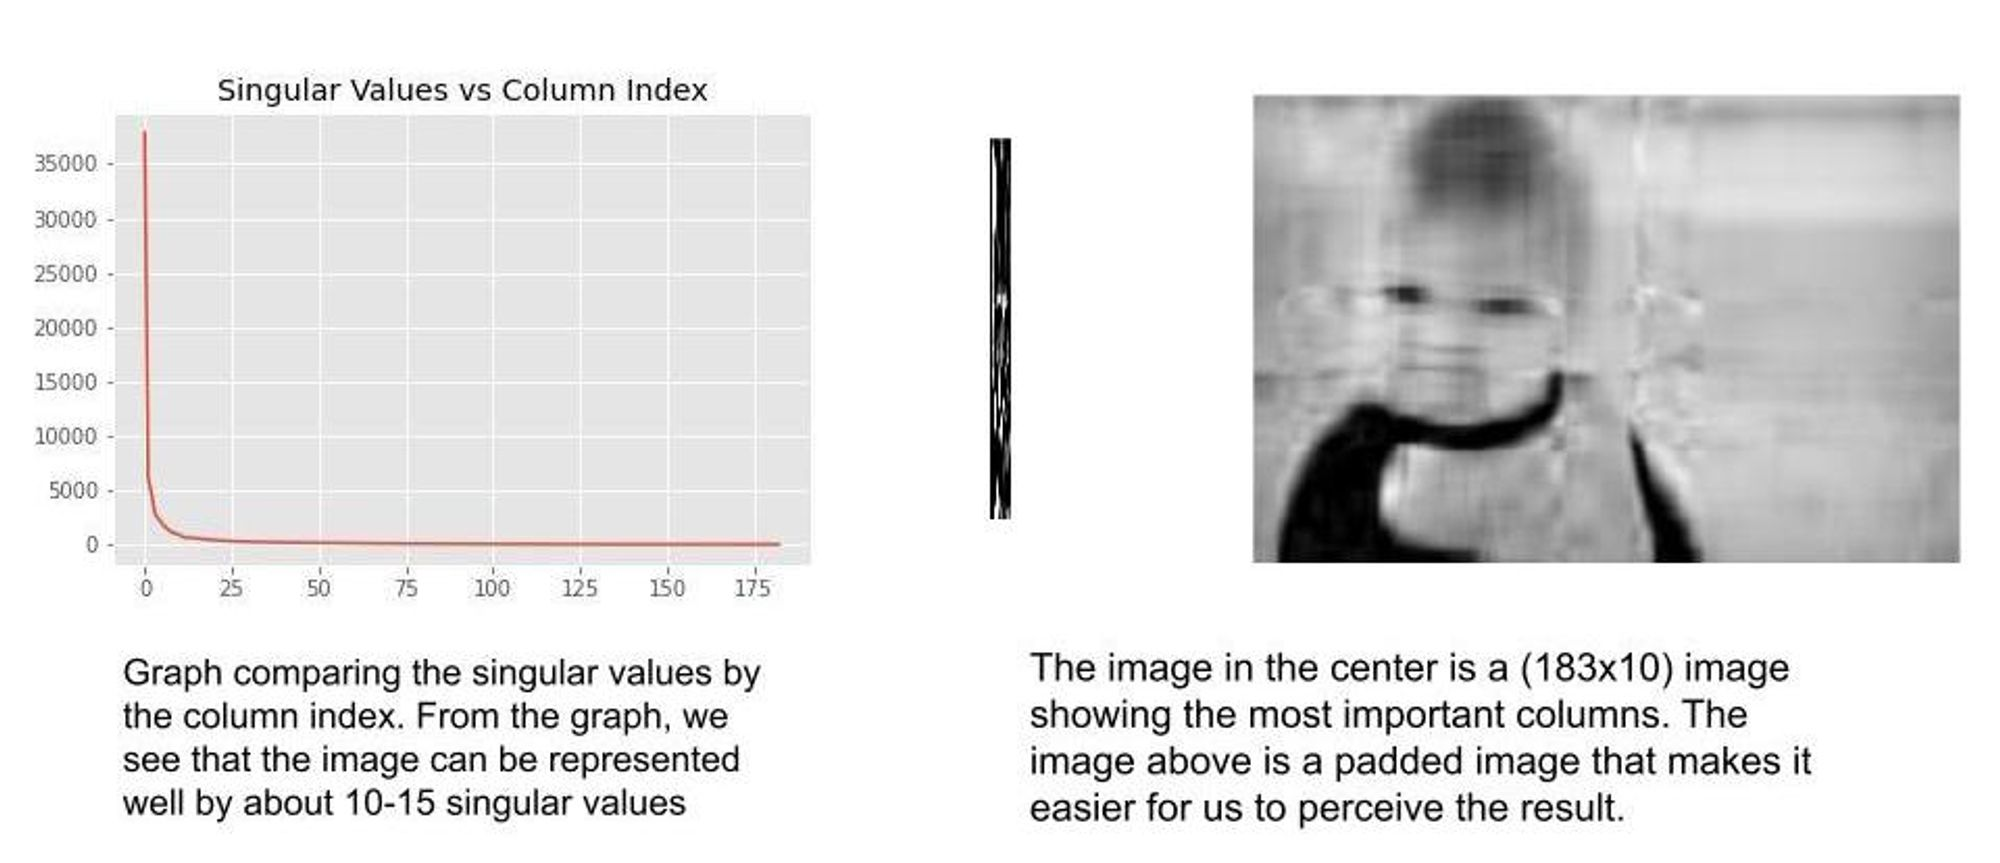
Singular Value Decomposition: To begin, we assume all the images are grayscale. This is a matrix decomposition method that reduces the matrix into 3 different matrices $U\Sigma V^T$ . $U \text{ and }V^T$ represent the vectors of the image matrix while $\Sigma$ represents the singular values. The highest singular values represent the most important columns of the image matrix. Therefore, if we want to represent the image matrix by the 20 most important values, we’ll simply recreate the image matrix from the decomposition using the 20 highest singular values. $Image = U\Sigma_{20} V^T$. Below is an example of an image represented by its 10 most important columns.
Modern Computer Vision Methods
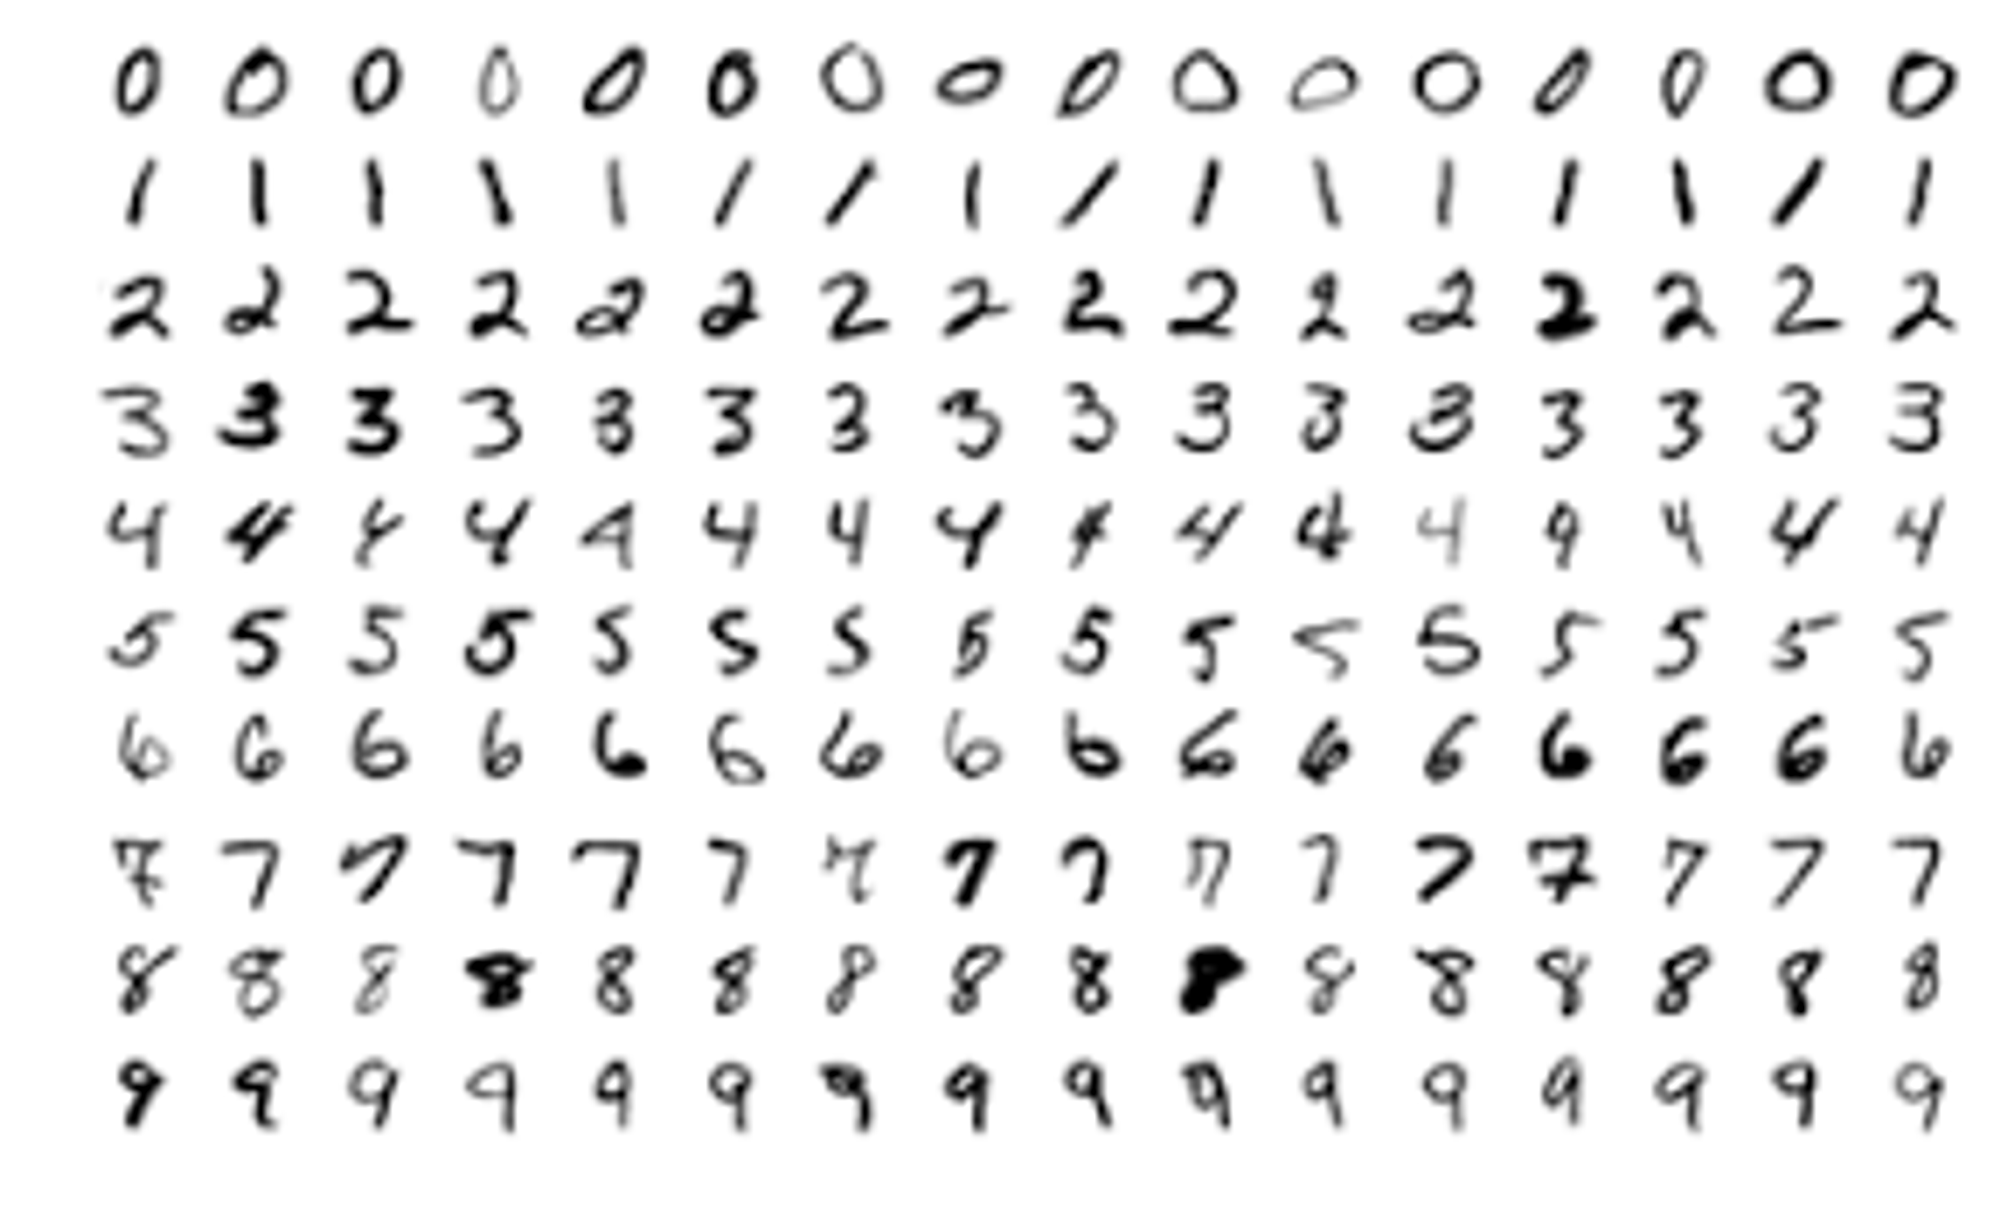
Well, when we look at the image above that represents the MNIST dataset there are various aspects that stick out to us as humans. Looking at it you notice the heavy pixelation or the sharp contrast between the color of the shape of the numbers and the white background. Let’s use the number 2 image from the dataset as an example.
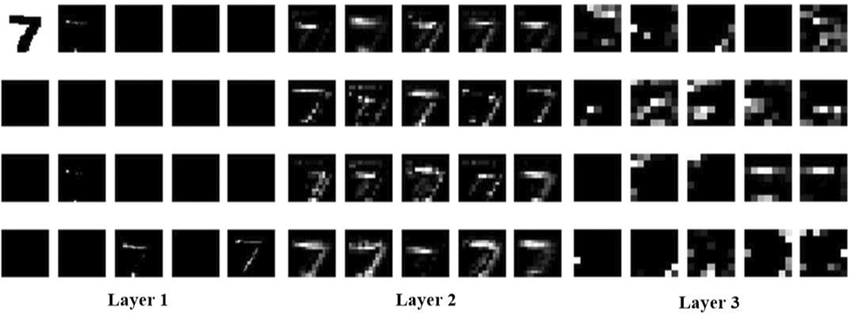
Modern machine learning methods rely on deep learning algorithms to determine the most important features of the input images. If we take the sample, number 2, and pass it through a deep convolutional neural network (DCNN), the network learns to deduce the most important features of the image. As the input data passes from the input layer to deeper layers in the network the dimensions of the image get reduced as the model picks out the most important features and stores them as feature maps that get passed from layer to layer.
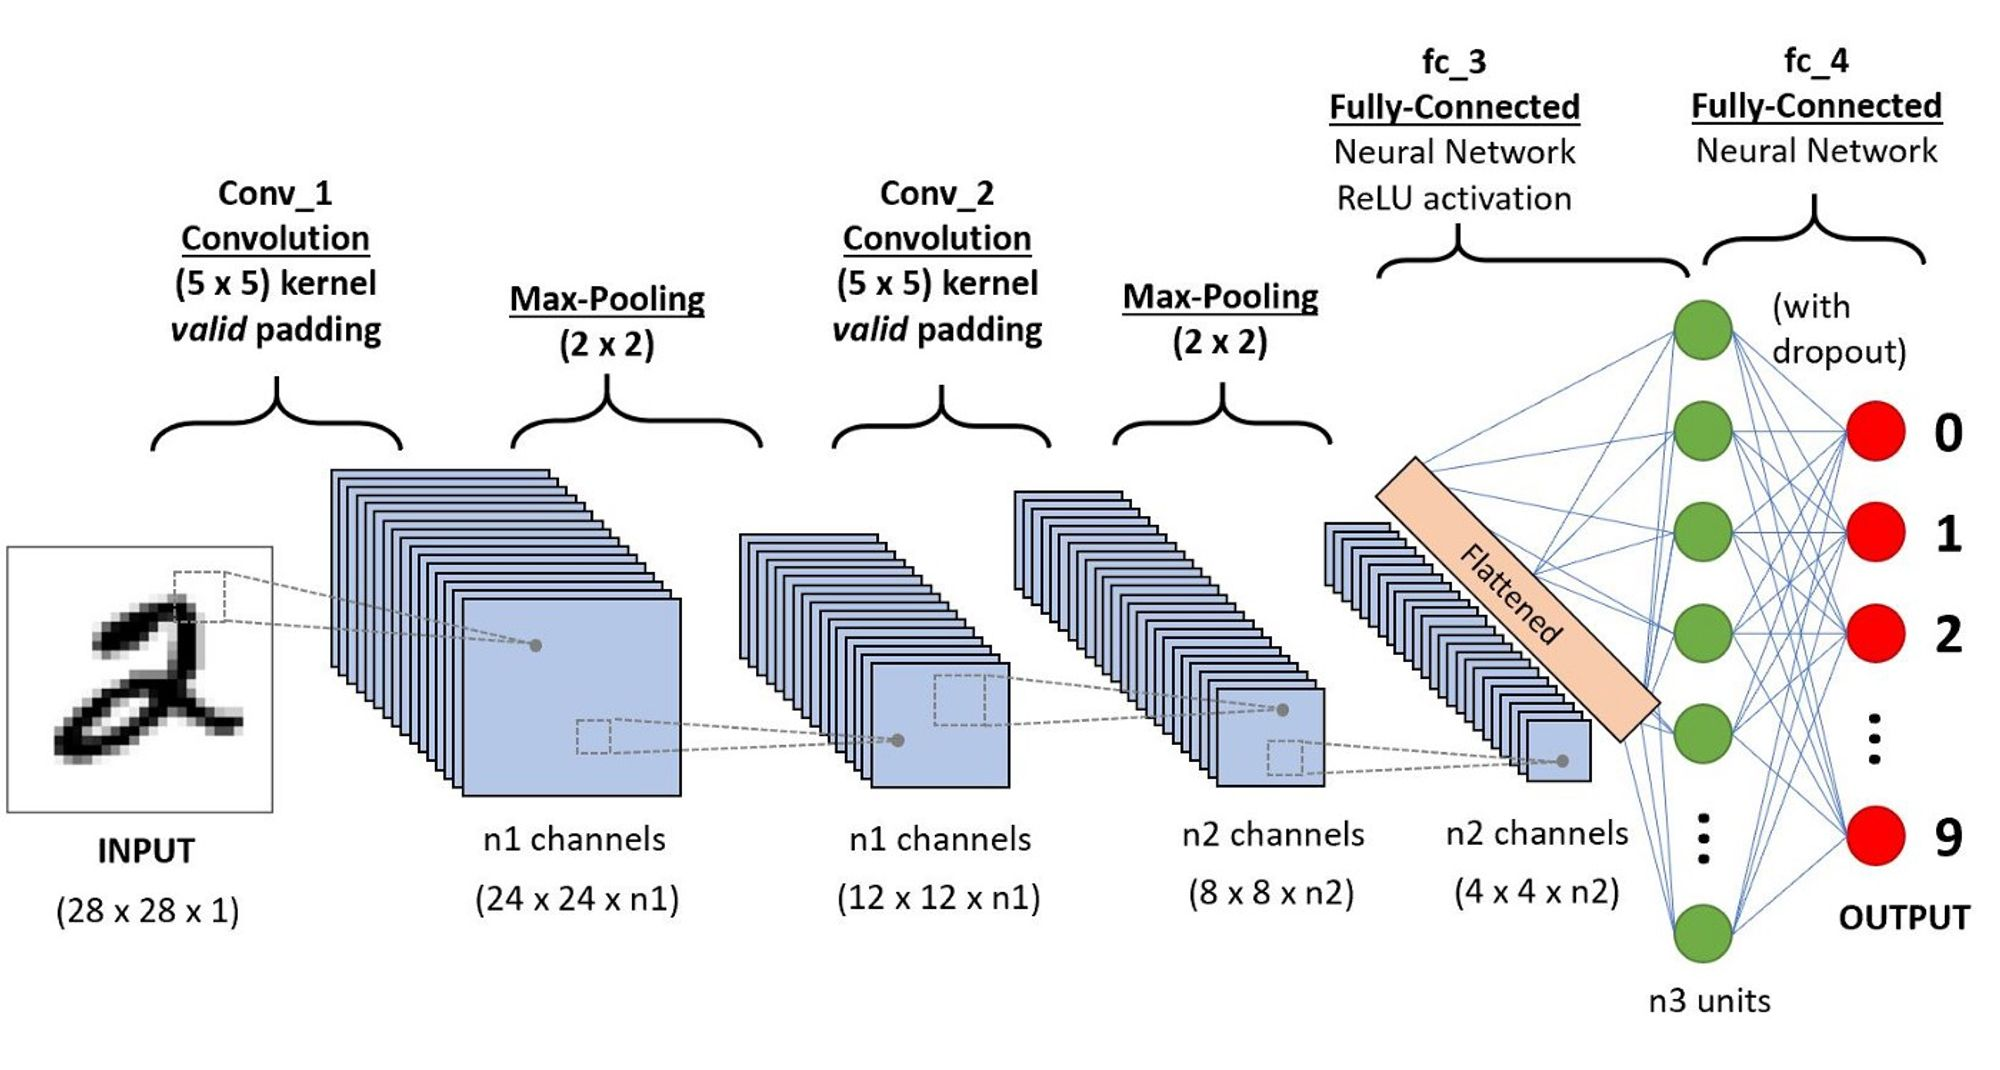
The paper by Liu, Jian, et al. helps visualize the transformations that go on when image data is passed into a DCNN. This helps to understand that the image isn't necessarily being cropped in every layer or being resized but you can imagine it as a filtration process.
During training, machine learning algorithms are exposed to a lot of varied data in the training set. A model is deemed as successful if it is able to extract the most significant patterns of the dataset which on their own can meaningfully describe the data. If the learning task is supervised, the goal of the model is to receive input data, extract and analyze the meaningful features, and then predict a label based on the input. If the learning task is unsupervised there is even more emphasis on learning patterns in the training dataset. In unsupervised learning, we do not ask the model for a label prediction but for a summary of the dataset patterns.
The importance of Image Representation in Image Generation
The task of image generation is unsupervised. The various models used: GANs, Diffusion Models, Autoregressive Models, etc. produce images that resemble the training data but are not identical to the training data.
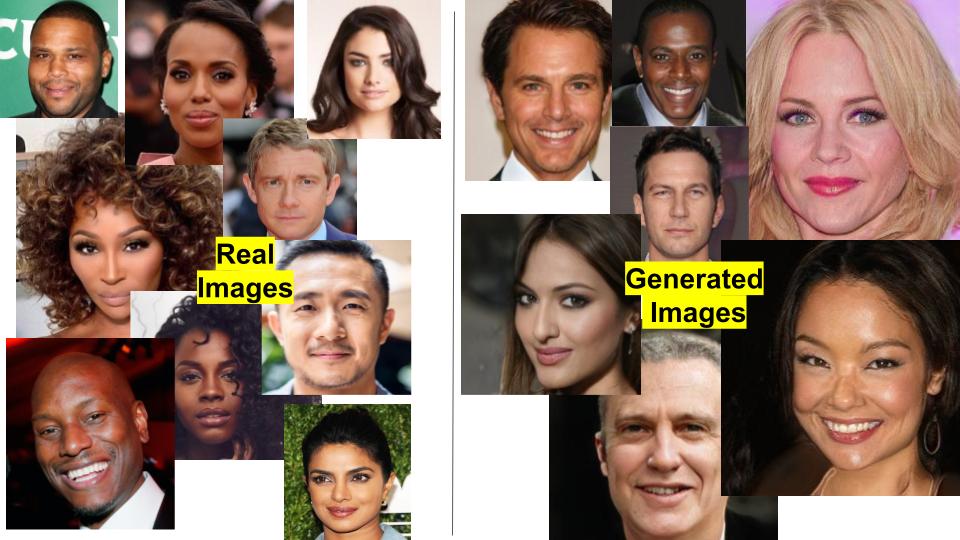
In order to evaluate the image quality and fidelity of the generated images we need to have a way to represent the raw RGB images in a lower dimension and compare them to real images using statistical methods.
Fidelity: The ability of the generated images to be similar to the training images
Image Quality: How realistic the images look
Previous methods for image feature representation include using the Inception Score(IS) and Frechet Inception Distance (FID) score which are based on the InceptionV3 model. The idea behind both IS and FID is that InceptionV3 was well suited to perform feature extraction on the generated images and represent them in lower dimensions for classification or distribution comparison. InceptionV3 was well equipped because at the time that IS and FID metrics were introduced, the InceptionV3 model was considered high capacity and ImageNet training data was among the largest and most diverse benchmark datasets.
Since then there have been several developments in the deep learning computer vision space. Today the highest capacity classification network is CLIP which was trained on about 400 million image and caption pairs scrapped from the internet. CLIP’s performance as a pretrained classifier and as a zero-shot classifier is beyond remarkable. It is safe to say, CLIP is far more robust at feature extraction and image representation than any of its predecessors.
How does CLIP Work?
The goal of CLIP is to get a really good representation of images in order to find the connection between the image and the same text.
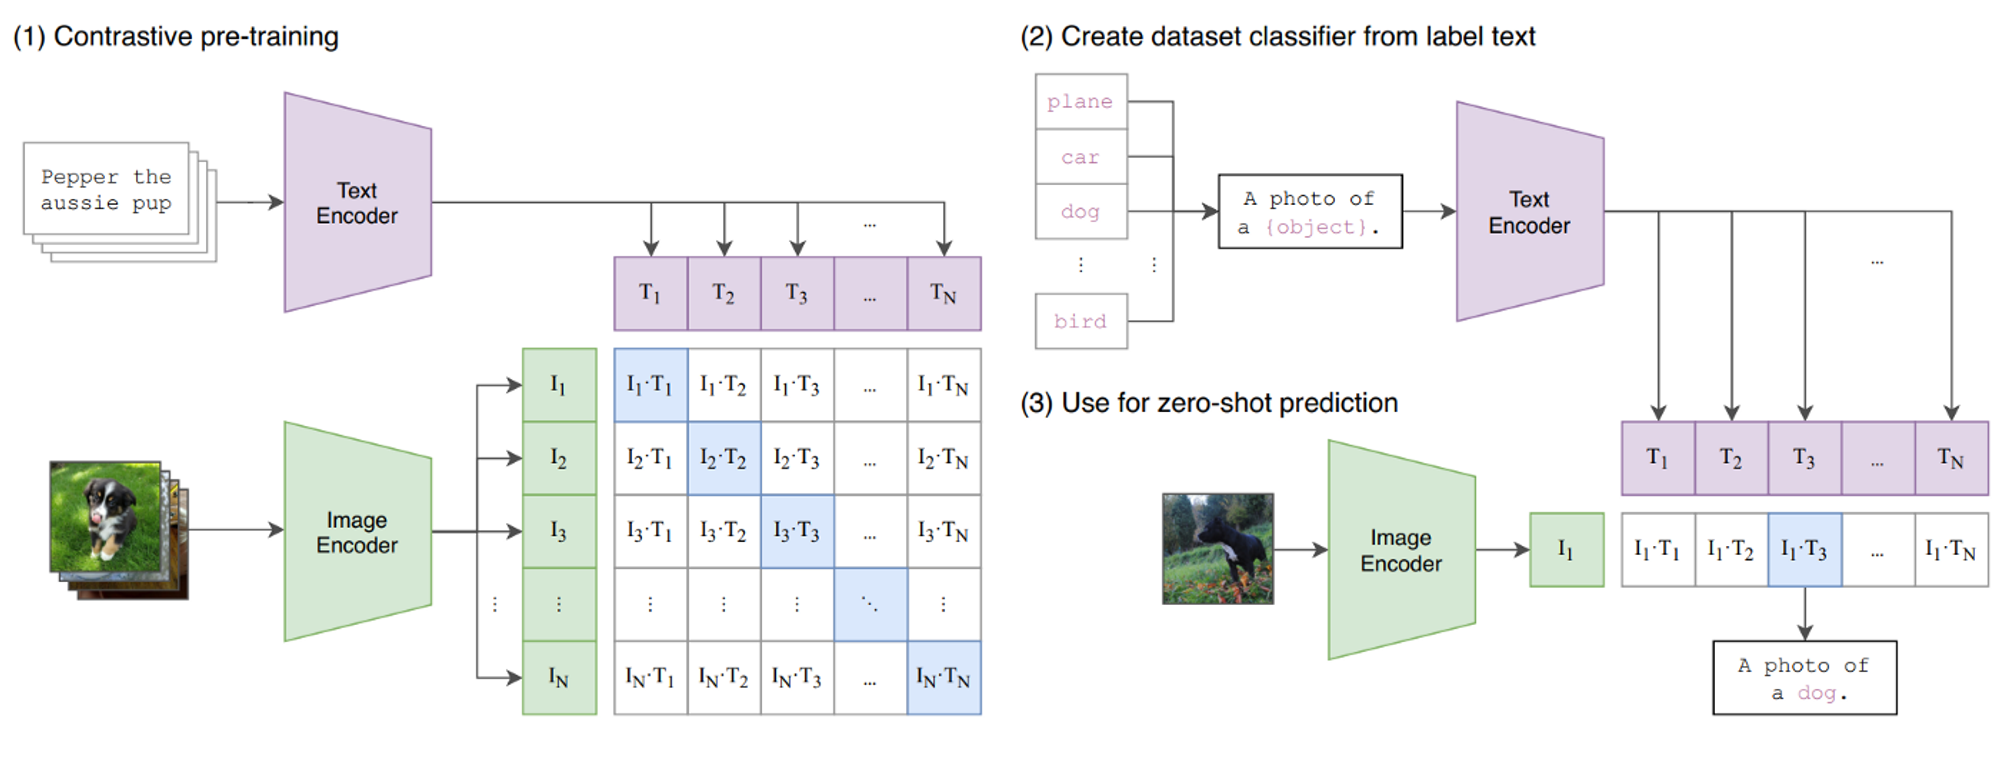
During Training:
- The model takes a batch of images and passes them through an image encoder to get the representation vectors $I_1 ...I_n$
- The model takes a batch of text captions and passes them through a text encoder to generate representation vectors $T_1...T_n$
- The contrastive objective is set to ask, “Given this image $I_i$, which of these text vectors $T_1...t_n$ matches $I_i$ the most. It is called a contrastive objective because the match $I_k \text{ and } T_k$ is compared against all other possible combinations of $I_k \text{ and } T_j$ where ${j \neq k}$
- The goal during training is to maximize the match between $I_k \text{ and } T_k$ and minimize the match between $I_k\text{ and }t_{j \neq k}$
- The dot products $I_iT_i$ is interpreted as a logit value therefore in order to find the correct text caption for an image we would pass the vector $[I_1T_1, I_1T_2,I_1T_3.....I_1T_N]$ into a softmax function and determine the highest value as corresponding to the label (just like in normal classification)
- During training, softmax classification is performed in the horizontal and vertical directions. Horizontal → Image classification, Vertical → Text classification
During Inference:
- Pass an image through the image encoder to get the vector representation of the image
- Get all the possible labels for your classification task and convert them into text prompts
- Encode the text prompts using the text encoder
- The model then performs the dot product between each prompt vector and the image vector. The highest product value determines the corresponding text prompt for the input image.
Now that we know how CLIP works, it becomes clearer how we can get image representations from the model. We use the image encoder of the pretrained model!
With proper image representations, we can analyze the quality of generated images to a higher degree than with InceptionV3. Recall, CLIP is trained on more images and more classes.
CLIP Score
This is an image captioning evaluation metric that has gained popularity in recent image generation papers. It was initially designed to be a fast reference-free method to assess the quality of machine-predicted image captions by taking advantage of CLIP’s large feature embedding space.
The original CLIP Score allows you to measure the cosine similarity between an image feature vector and a caption feature vector. Given a fixed weight value $w =2.5$, the CLIP image encoding as $v$, and the CLIP textual embedding as $c$, they compute the CLIP score as:
$\text{CLIP-S}(\textbf{c,v}) = w*max(cos(\textbf{c,v}),0)$
This would be a great metric if you wanted to assess the image features based on text. I think this type of analysis would be great for computer vision projects aimed at explainability. If we can match features with human-readable text, we gain a better understanding of the image beyond the visual queues.
In instances where we are not concerned with the text captions associated with the text, we simply pass the images we want to evaluate into the CLIP image encoder to get the image feature vectors. We then calculate the cosine similarity between all the possible pairs of image vectors and then average by the number of possible vectors. This method was developed by Gal, Rinon, et al. and computes the “average pair-wise CLIP-space cosine-similarity between the generated images and the images of the concept-specific training set” in batches of 64 images.
Citations:
- Radford, Alec, et al. "Learning transferable visual models from natural language supervision." International conference on machine learning. PMLR, 2021.
- Hessel, Jack, et al. "Clipscore: A reference-free evaluation metric for image captioning." arXiv preprint arXiv:2104.08718 (2021).
- Gal, Rinon, et al. "An image is worth one word: Personalizing text-to-image generation using textual inversion." arXiv preprint arXiv:2208.01618 (2022).
- Sauer, Axel, et al. "StyleGAN-T: Unlocking the Power of GANs for Fast Large-Scale Text-to-Image Synthesis." arXiv preprint arXiv:2301.09515 (2023).
- Liu, Jian, et al. "CNN-based hidden-layer topological structure design and optimization methods for image classification." Neural Processing Letters 54.4 (2022): 2831-2842.