We've been hard at work developing Gradient° into a robust and scalable deep-learning platform. Here's a roundup of some of the things we've added recently:
Product release notes can be found here and API release note are located here
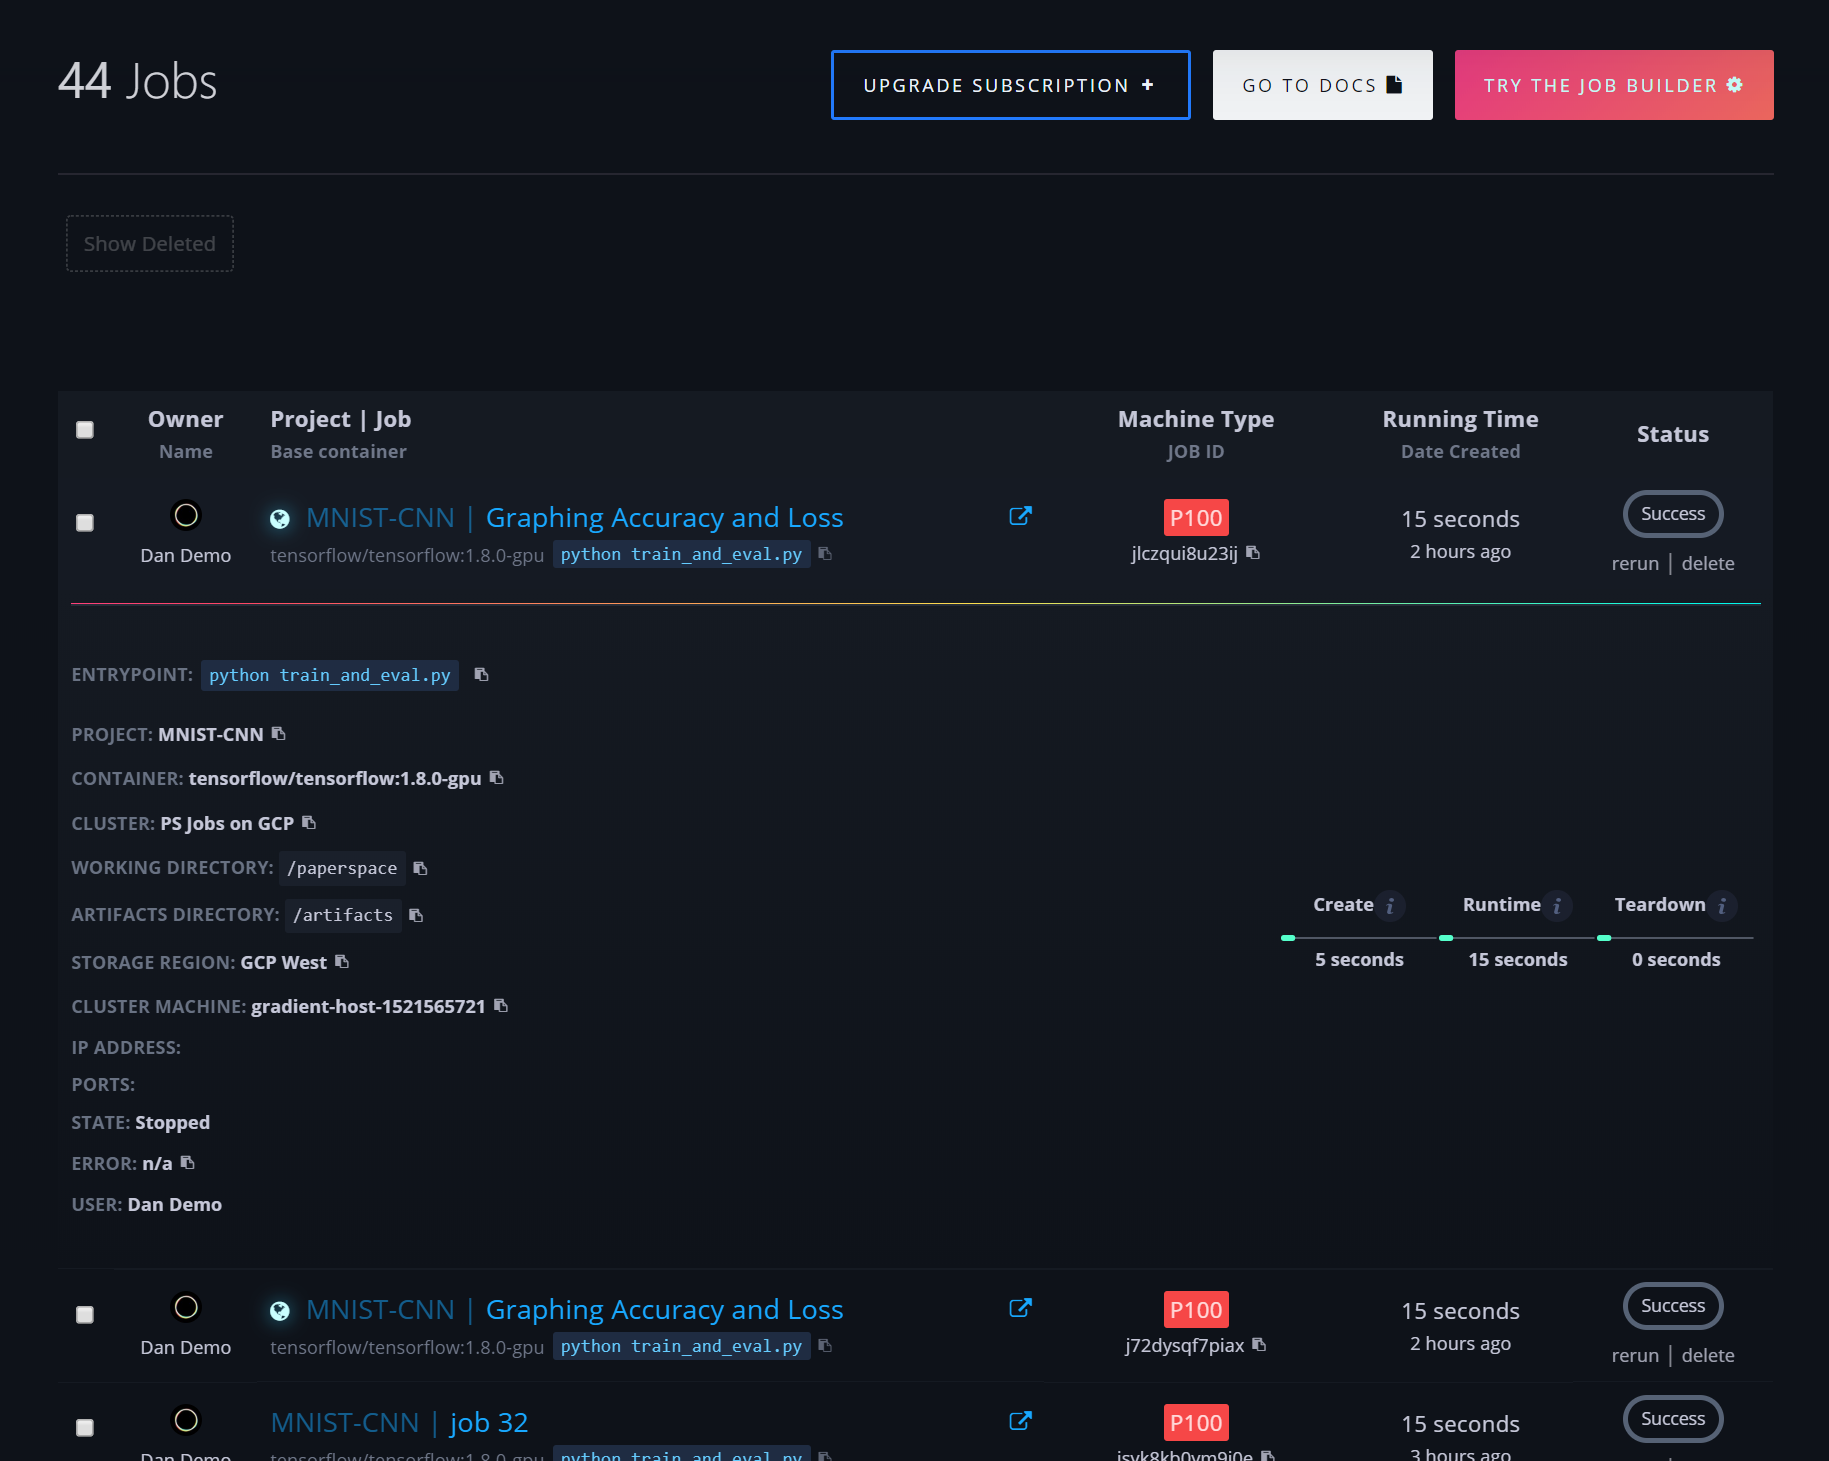
New Jobs page
In addition to the summary view on the main Jobs page, we've added a standalone page with all sorts of new functionality.
Summary view
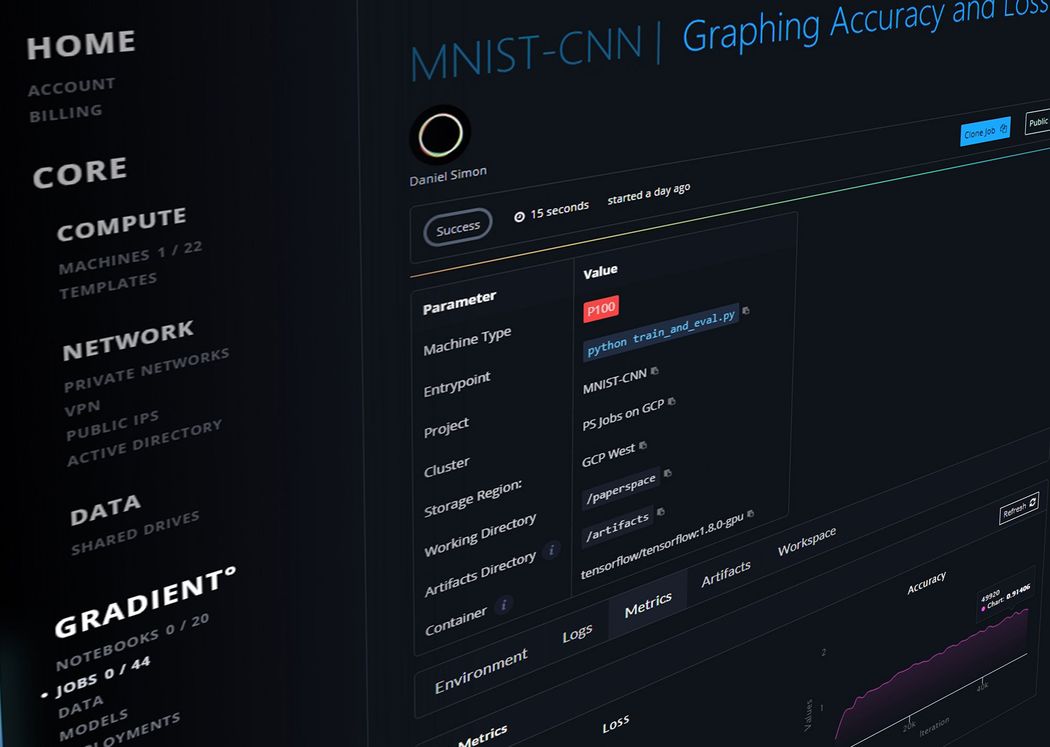
To drilldown into the new Job details page, click the arrow icon next to the Job name. The Job details page includes everything about your Job: Parameters, environment, logs, metrics, and code all in one place.
New Jobs details page
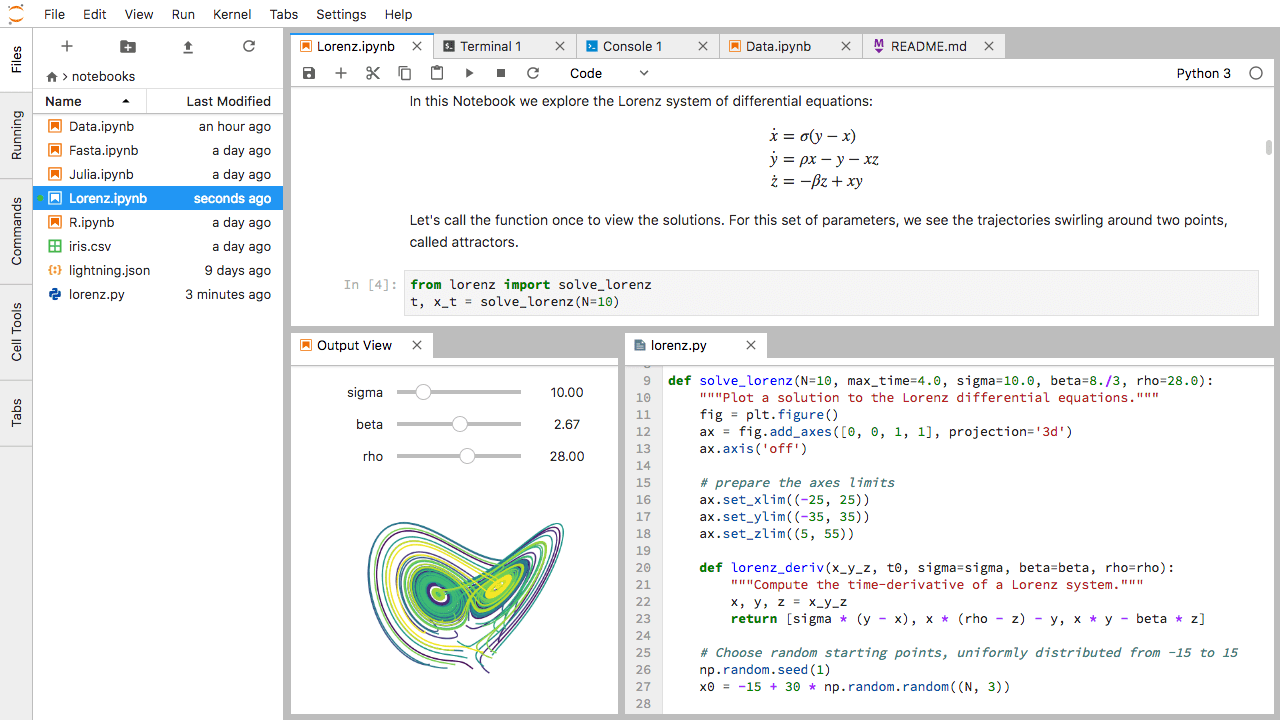
JupyterLab
JupyterLab is the next-generation web-based user interface from Jupyter. This new version includes multiple tabbed documents, an improved terminal, customizable shortcuts etc. Here's an overview. We've added the Data Science Stack and the R Stack containers as Base Container options.
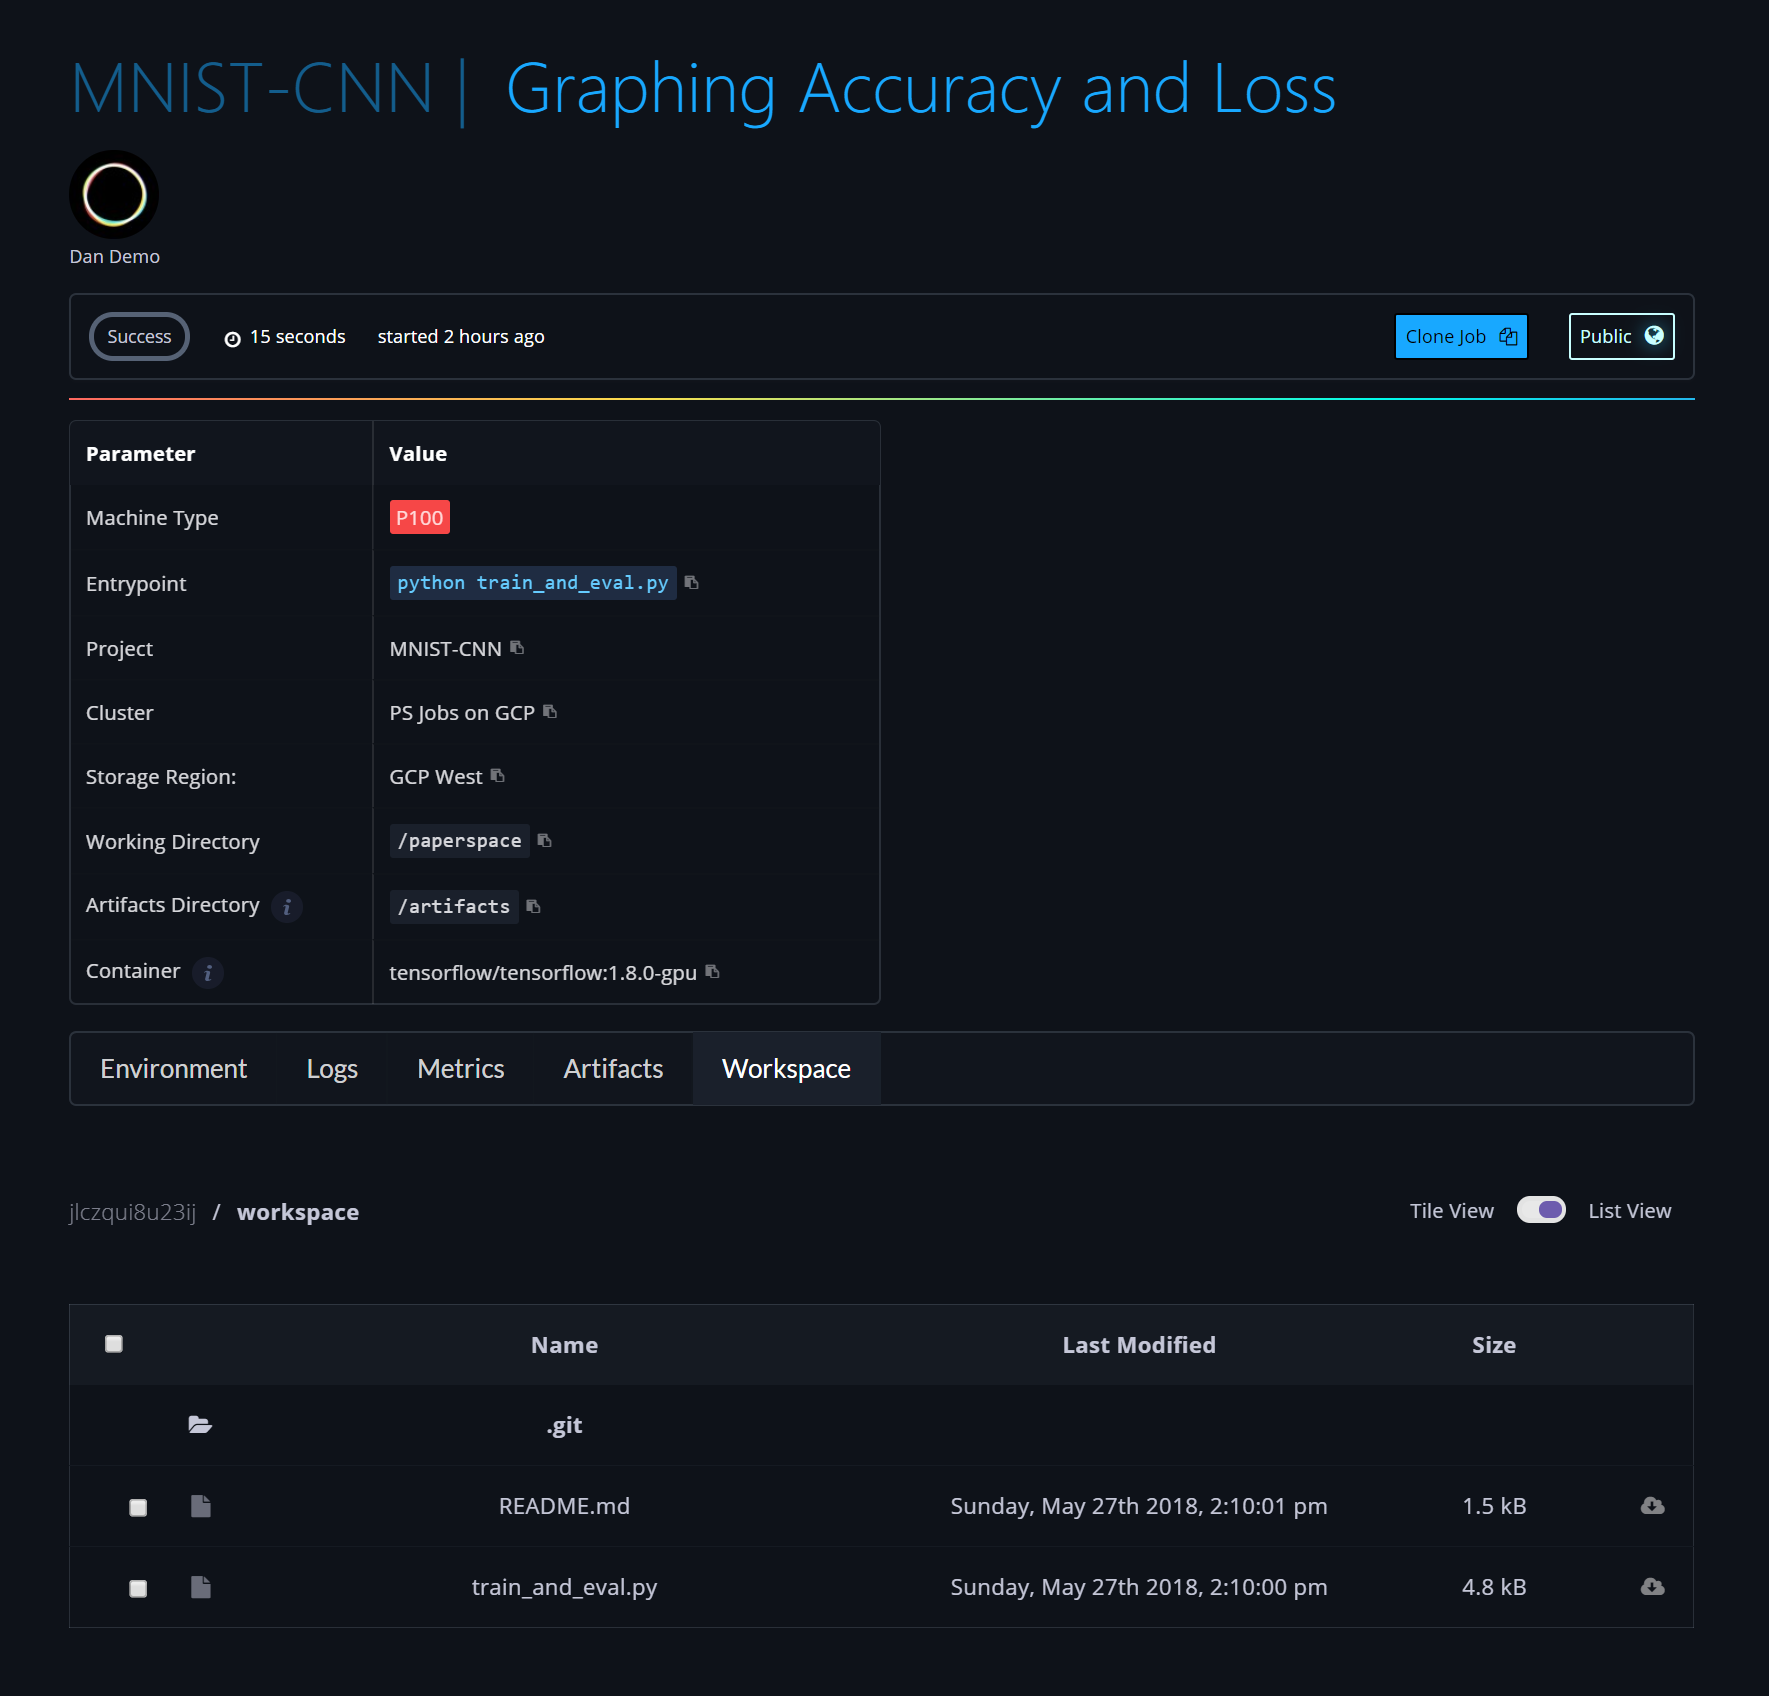
Public Jobs
Getting a functioning environment set up can be a bear. With public Jobs, you can easily package your Job and share it with others. Just click the button in the upper right to make a Job public so anyone can clone it in their own account. You can convert the Job to private at any point.
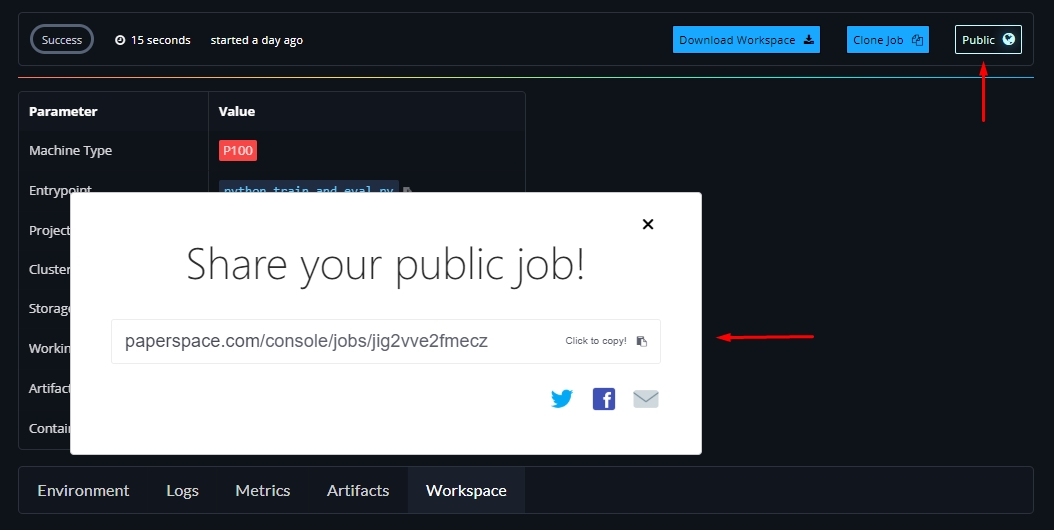
Here's a public Job example
Persistent Storage accessible in Notebooks
Jupyter is a great environment for managing data which you can now use to manage your persistent storage in Gradient. The persistent storage will be automatically mounted to every Notebook (and Job) in your account. Just spin-up a Notebook and you'll see the /storage directory. Here you can easily upload data, move files around etc.
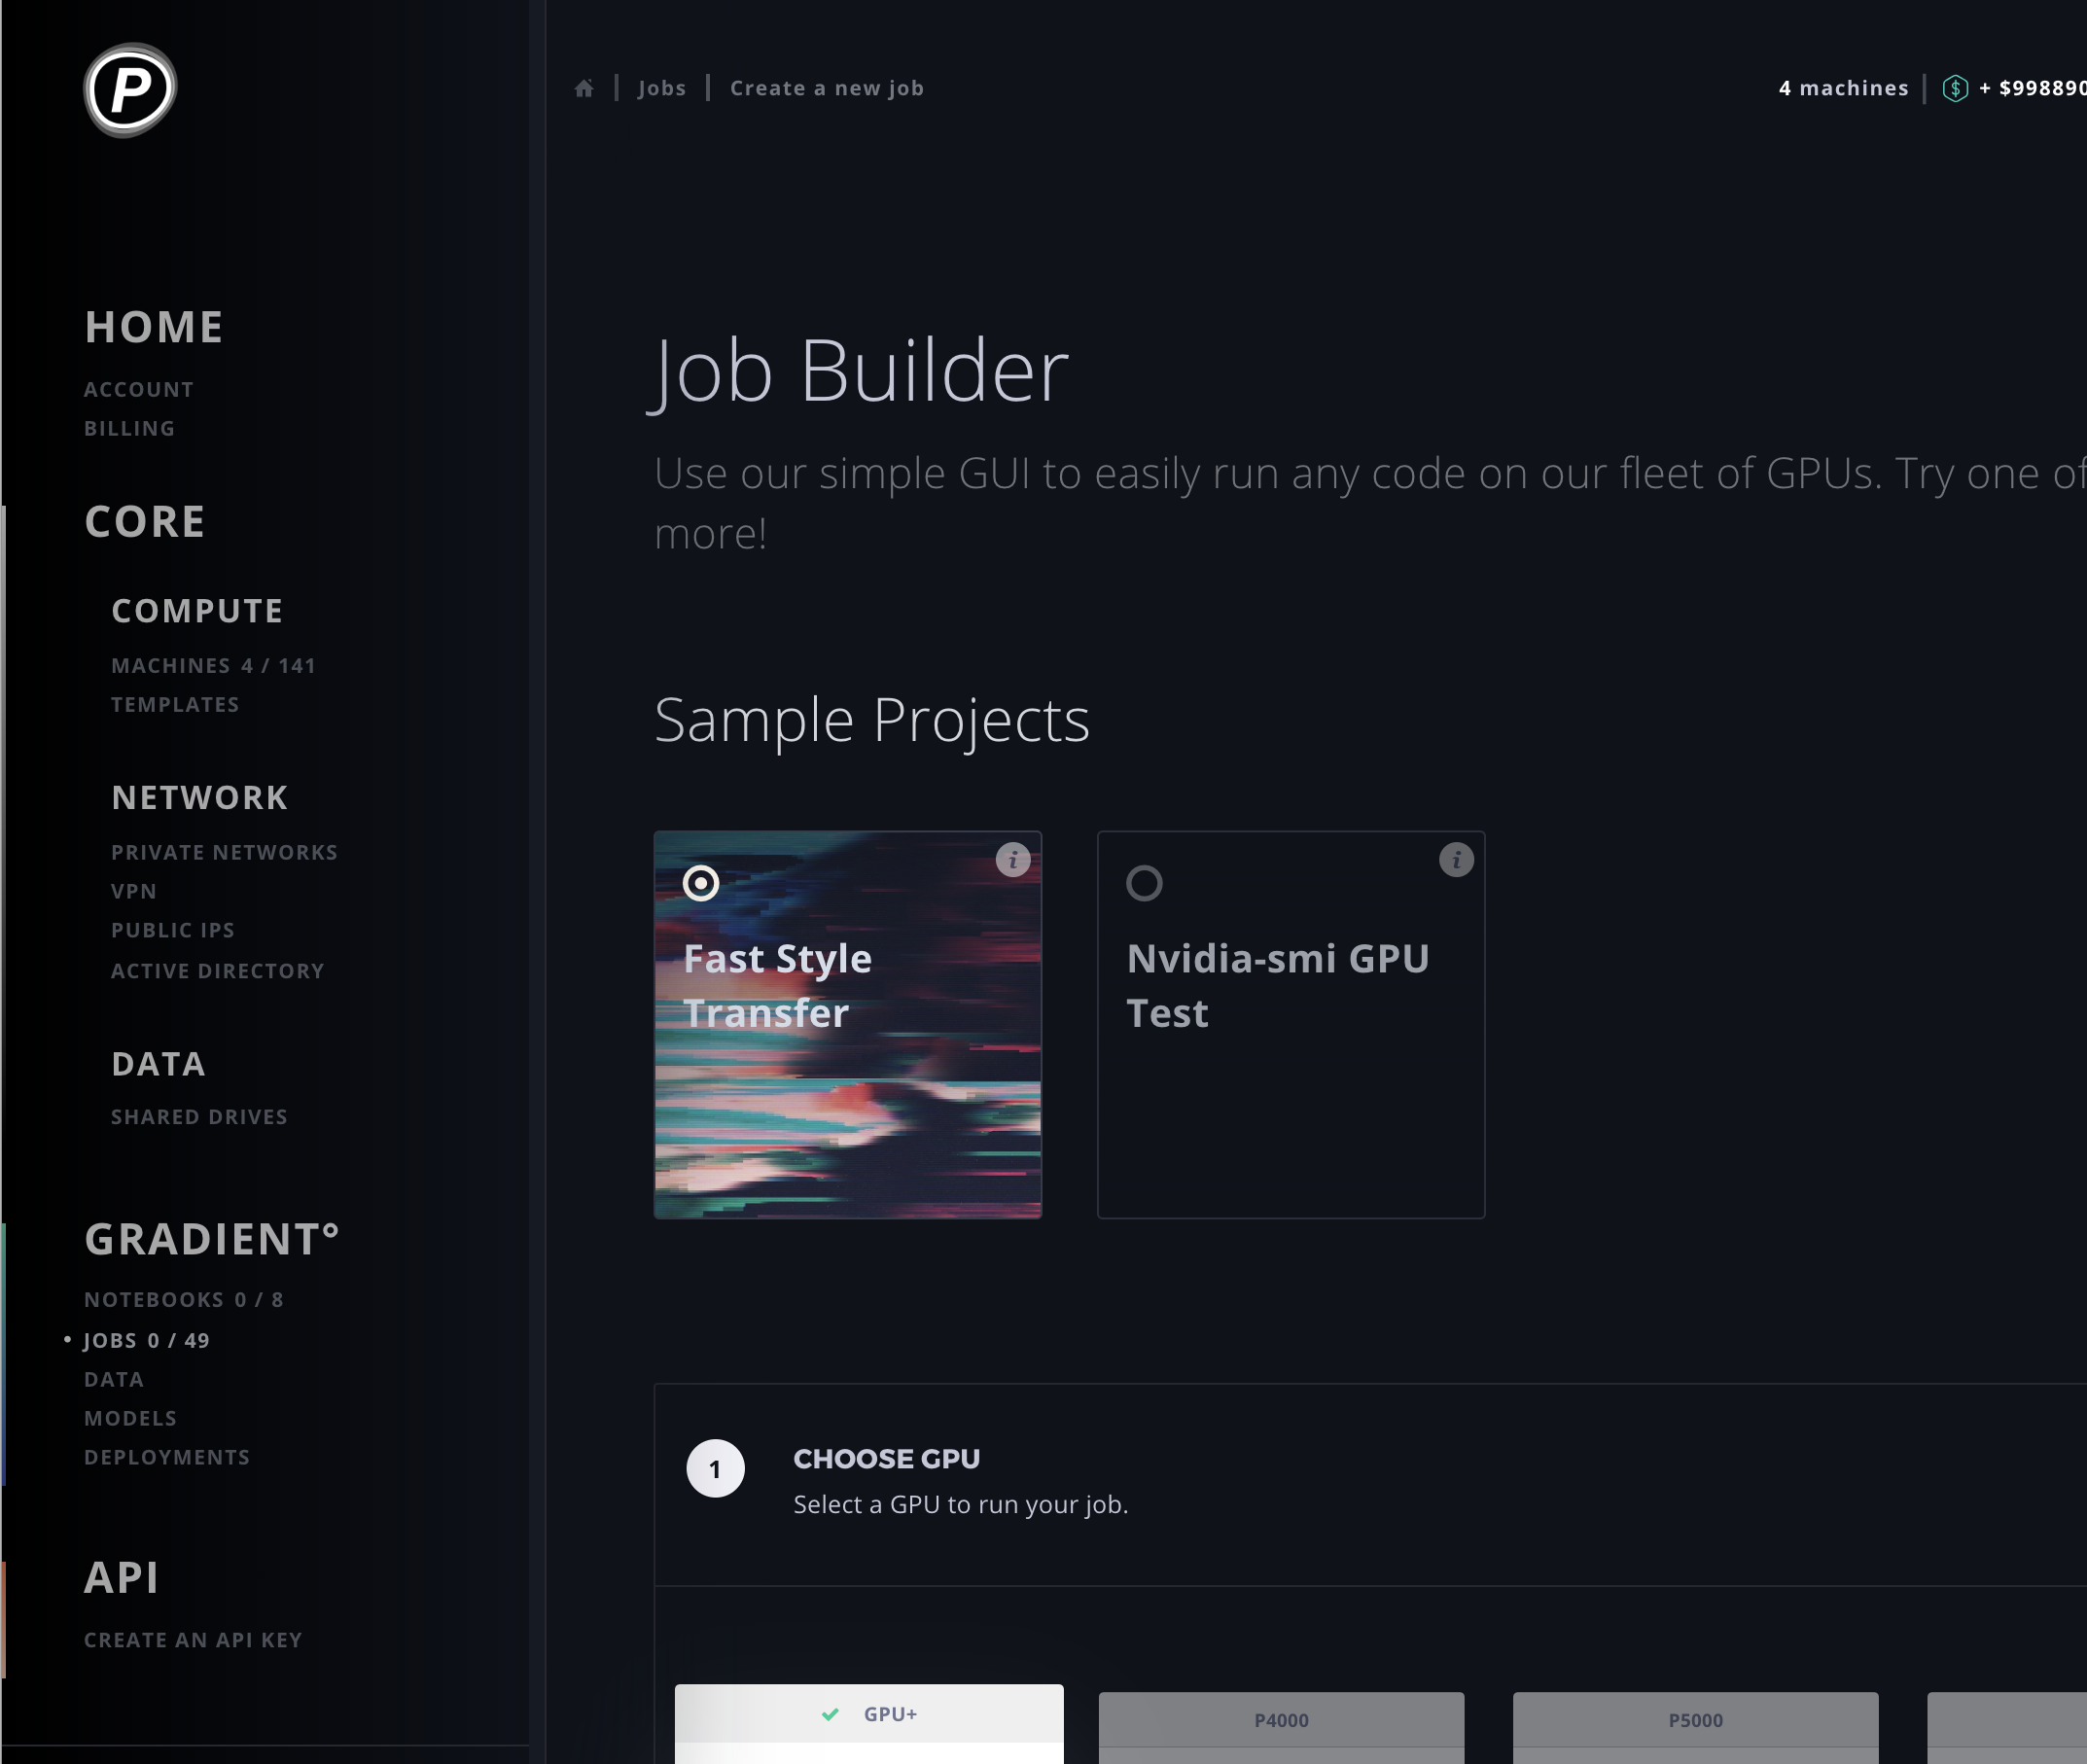
Job Builder UI
New to Gradient or not a fan of working in command-line? Try the new graphical Job Builder, a step-by-step UI for constructing Jobs. The section at the top includes a few sample projects you can run with just a couple clicks. More documentation can be found here
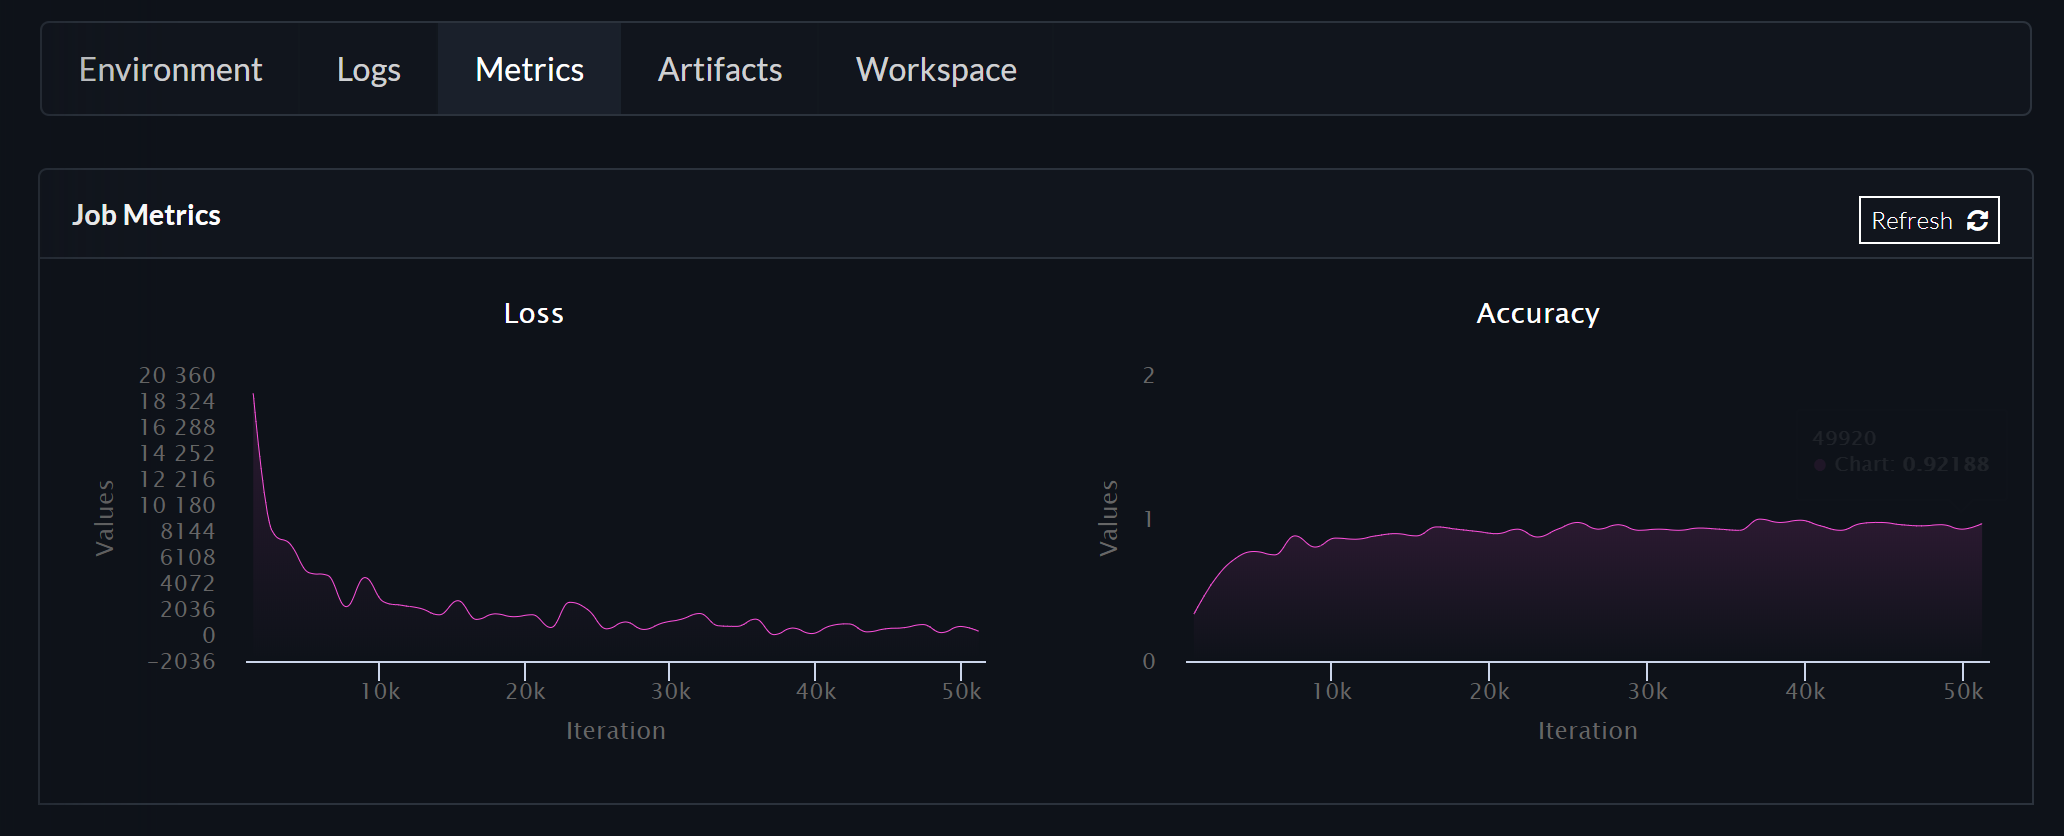
Job Metrics
It's important to understand the performance of the model you are training. Metrics like accuracy, loss and validation are often used for this purpose. We added a section of the Jobs page to plot these metrics. Since training can take hours, or days, or even weeks, it's important to track metrics in real time. Just add a few lines to your code and we'll parse the output and convert them into metrics. Graphs will begin plotting as soon as the model begins training and will be available after the job is complete for reference/comparison.
# Initializing charts
print('{"chart": "loss", "axis": "Iteration"}')
print('{"chart": "accuracy", "axis": "Iteration"}')

# Graph Loss and Accuracy
print('{"chart": "loss", "x": <value>, "y": <value>}')
print('{"chart": "accuracy", "x": <value>, "y": <value>}')
Here's an example of what a typical output will look like: