
The above quote is from the book Fight Club, which was also made into a movie starring Brad Pitt, Edward Norton, and Helena Bonham Carter. I was only a year old when the book came out in 1996. Tyler Durden, the protagonist, talks about how the current generation is in a crisis because they haven't been witness to a landmark event which broke their lives in two, before and after. In a way, that was also true for a millennial like me, until the new coronavirus pandemic hit us.
Now let me be clear. It's not as if economies haven't tanked in the last few decades (e.g. Zimbabwe, Venezuela). Neither am I denying that parts of world have faced pandemics that have ravaged thousands of lives (SARS, Ebola, etc.). But almost all of these have been limited to certain parts of the world, so the other parts could come to the rescue. The devastation that the coronavirus has bought to the world at large–whether it be the overburdened health care systems, millions being put into lockdown, children missing school, or the economies taking a massive hit–has been largely unprecedented.
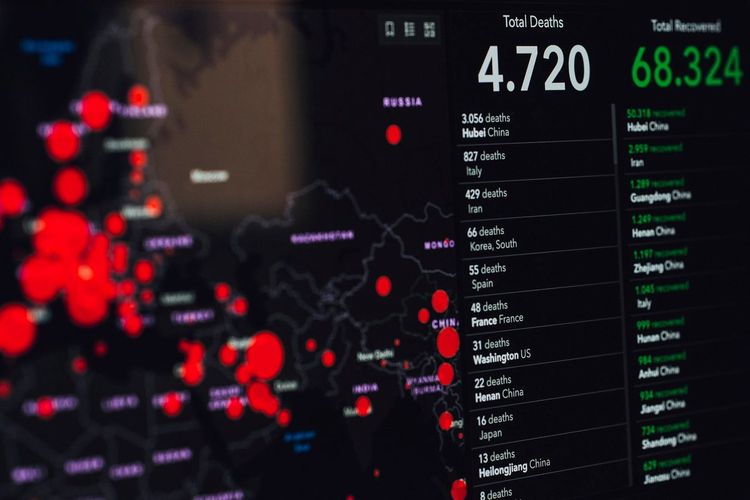
Here is a live dashboard by Johns Hopkins University, which keeps track of the cases around the world. At the time of publishing the article, there are nearly 900,000 cases in the world already.
While Tyler Durden advocated an amateur fight club where people would beat each other to a pulp as a way to cope up with their existential rage, advances in AI and data science have put many of us in positions to help humanity beat the coronavirus to a pulp. Of course, the latter option is also better, since the former doesn't play very well with the idea of social distancing.
Bring this project to life
What's this series about?
Unlike earlier series I've done (covering GauGAN, implementing YOLO from scratch, data augmentation for bounding boxes, among others), how this series will evolve is much more open-ended. Research into how AI can be used to tackle the coronavirus is a work in progress as we speak. At this point, the medical data on COVID-19 (say CT scans of patients) in the public domain is scant at best. Of course, medical data can take time to reach the public eye due to privacy concerns.
That being said, we are seeing research pop up in several areas that deal with the use of AI to tackle the coronavirus. Some of these include:
- Using computer vision-based deep learning as a tool to help diagnose COVID-19 given a lung CT scan of a patient.
- Trying to come up with treatments using deep learning-based protein folding solutions.
- Using NLP to extract meaningful insights from the large corpus of literature on COVID-19.
- Using computer vision-assisted surveillance to monitor crowds and, for example, enforce social distancing.
The idea of this series to look into such avenues of research, and if possible, provide you with toy examples so that you can start working towards a solution when the data becomes available.
What we'll cover in this article
In this post, I will talk about:
- The importance of testing in addressing the pandemic.
- Challenges with the current testing kits.
- Several new papers that outline how deep learning can be used to diagnose COVID-19 from CT Scans
- How to interpret the results of a deep learning diagnosis system, and some caveats.
First, A Disclaimer...
Before I go further, let me say that I am not a medical or radiology professional. My experience is in machine learning, deep learning, and computer science. Whatever I write comes from my limited study of medical imaging, and if I write something incorrect and you happen to be a professional, please hit the comment section below and let me know so I can fix it.
TEST. TEST. TEST.

These are folks from the World Health Organisation (WHO). In one of their press conferences, the guy in the middle said that his foremost advice to countries would be to "Test, Test, Test" as many people as possible, and if possible, to test each symptomatic person for coronavirus, regardless of travel or contact history.
When it comes to the coronavirus, testing becomes really important because you might not show symptoms from 5-14 days (this is called the Incubation Period). In this time, if you're not isolating yourself, you would be spreading the virus to the people you come in contact with.
RT-PCR Test
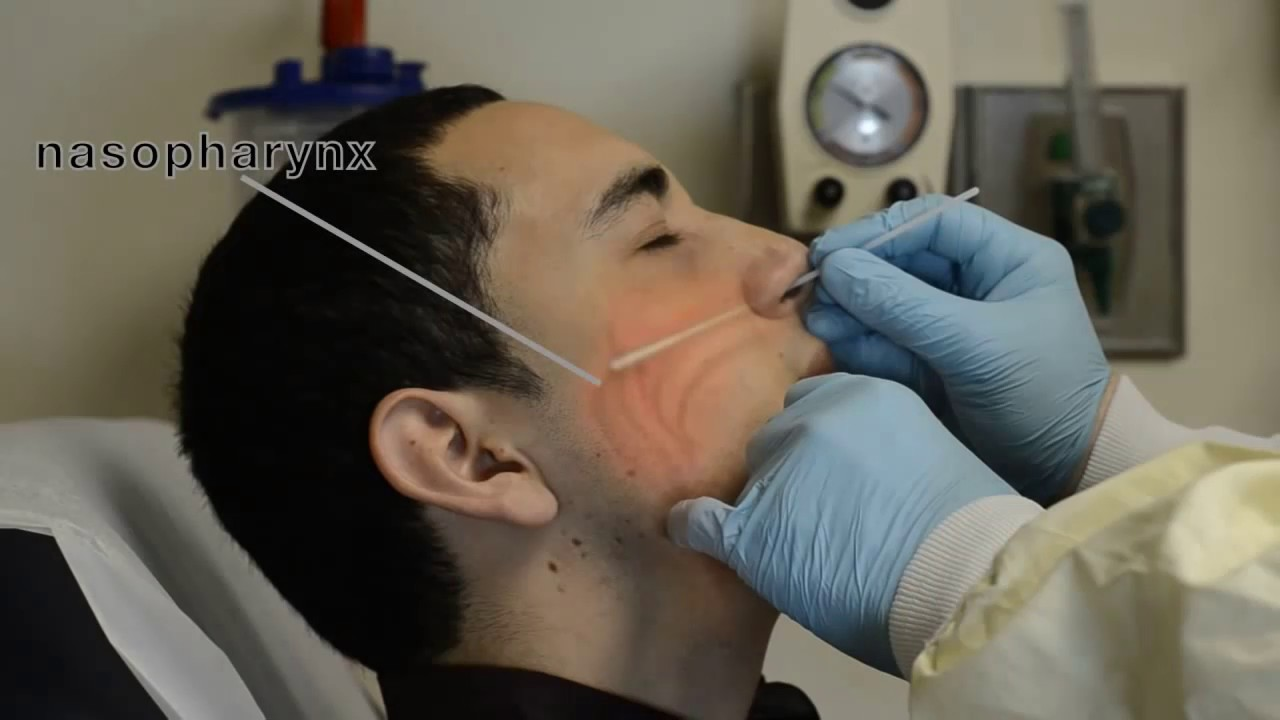
The gold standard that is being used right now to test COVID-19 patients is something called the Reverse transcription polymerase chain reaction test, or an RT-PCR. It involves taking a swab from a person's nose or throat, and then sending it to a machine that checks for the presence of the virus. However, the RT-PCR approach is not without its faults.
- These swab samples need to be transported to a testing center where the RT-PCR machines are. If this takes too long, the virus may die and an infected patient's swab may turn negative.
- They are expensive.
- It has been observed that the RT-PCR test has a low sensitivity, i.e. a high likelihood of giving false negatives. This is why governments often do multiple tests for confirmation.
- They also give a lot of false positives. This is problematic because you may end up unnecessarily burdening your health system with people who don't actually have the virus.
If you are still not convinced, sample collection may involve shoving a Q-tip so far into your nose that it feels like it's touching your brain. That's how people describe it. No kidding.
CT Scan
Research on data collected from hospitals in Wuhan has shown that among infected people, CT scans have a much better sensitivity than RT-PCR when it comes to diagnosis of COVID-19. According to this study conducted on 1014 COVID-19 patients published in Radiology, RT-PCR could only flag 601/1014 (59 %) patients as positive, whereas the CT-Scan flagged 888/1014 (88%) patients as positive.
"The results showed that 601 patients (59 percent) had positive RT-PCR results, and 888 (88 percent) had positive chest CT scans. The sensitivity of chest CT in suggesting COVID-19 was 97 percent, based on positive RT-PCR results. In patients with negative RT-PCR results, 75 percent (308 of 413 patients) had positive chest CT findings. Of these, 48 percent were considered as highly likely cases, with 33% as probable cases. By analysis of serial RT-PCR assays and CT scans, the interval between the initial negative to positive RT-PCR results was 4 to 8 days."
This study reports that sensitivity for CT scans is about 97 percent, while for RT-PCR, it's about 71 percent.
Based on these findings, we have some reason to believe that using CAT scans for diagnosis would beneficial. However, given a CAT scan, you'd still need a qualified radiologist to confirm the presence of COVID -19. Unfortunately, radiologists are limited in number and can be really pressed for time, especially if cases explode as they did in Italy.
Characteristics of COVID-19
This is what a CT scan of a healthy patient looks like.
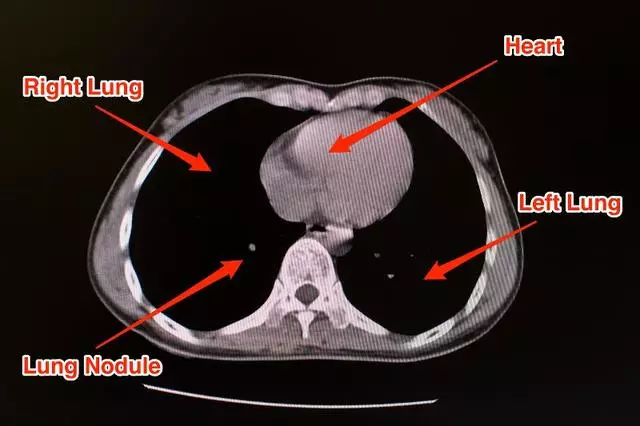
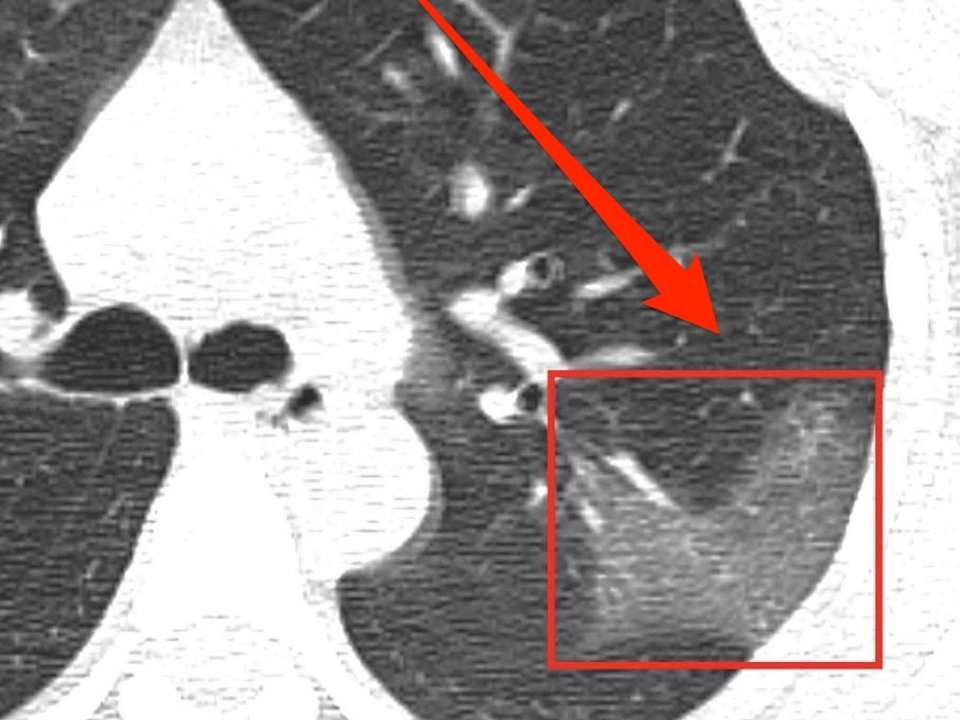
Now let's consider the CT scan of a patient who's suffering from pneumonia brought on by COVID-19.
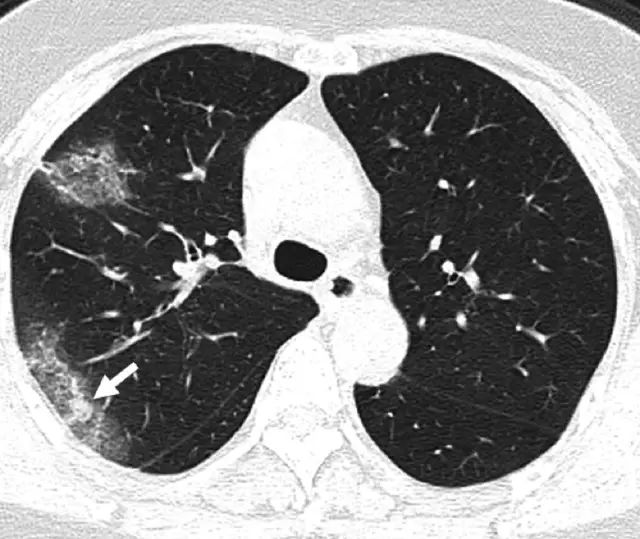
Generally, pneumonia causes fluid to build up in the lung, which manifests itself as opacities in the lung. The literature on application of deep learning to diagnose COVID-19 using CT scans does point to some distinct characteristic features found in lung CT scans of COVID-19 as compared to other types of pneumonia, resulting from different causes.
A paper, titled Deep Learning System to Screen Coronavirus Disease 2019 Pneumonia, lists three such characteristics:
"...ground-glass appearance, striking peripheral distribution along with the pleura, and usually more than one independent focus of infections for one case."
- The first means that the opacities in the lung look like ground-glass.
- The second means that the majority of these opacities occur along the edge of the lung.
- The third means that we can have more than one such cluster of opacities.
All three of these characteristics can be observed in the CT scan image of the lung above.
If you want to know more about features of CT scans of COVID-19 patients, here's a brilliant article that covers this topic.
Detecting Coronavirus Using Deep Learning
The last few years have seen a surge of applications of computer vision in the field of medical imaging to diagnose various ailments. Examples include Stanford's CheXNet for diagnosing pneumonia from lung X-rays, prediction of cardiovascular risk factors from retina images, and skin cancer classification.
On similar lines, a few recent research papers have been published that basically take CT scans and try to predict whether the person is suffering from COVID-19 or not. To keep yourself updated, you can always check Google scholar.
CT Scan Data
A CT scan (or computed tomography scan) is done using a machine where a scanner goes around your body to create a 3-D model of your organs. Here's a demonstration how a CT Scanner works.
So, your data in this case is going to be either...
- A 3-D volume, for which you will have to use a 3-D Convolutional Net.
- Multiple cross-sectional slices, for which we can use a 2-D neural network.
Extracting Regions of Interest (ROI)
All of these approaches involve some amount of data preprocessing to carve out Regions of Interest from the CT Scan as a first step. Once these ROIs are extracted, they are sent to a deep neural network to classify the cases as COVID-19 or another category, such as Bacterial Pneumonia, Viral Pneumonia, No Infection, etc. (the "other" categories vary throughout the papers).
Here's an example from the paper Deep Learning System to Screen Coronavirus Disease 2019 Pneumonia, which works on 2-D slices of the CT scan.
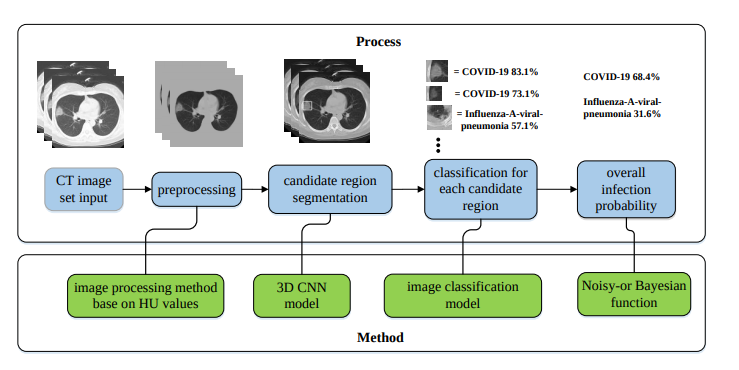
The paper first segments the lung using image preprocessing methods. Then regions of interest are extracted using the VNET20-based segmentation model VNET-IR-RPN17. The model itself was trained for extracting ROIs from pulmonary tuberculosis, but it was found that it worked well enough for the COVID-19 use case as well.
Then each RoI is run through a classification model, where we get the class probabilities. There can be one or more RoIs, giving us multiple probabilities. These probabilities are then combined using something called a Noisy-or-Bayesian function. More details about this can be found in the paper linked above.
$$ Score = 1 - \sum_{i=1}^{No. \: of \: RoIs} P_{i} $$
The paper also leverages the fact that for coronavirus, often the opacities are found around the edges of the lungs, which is used as an input to the network at a later phase. The details on how exactly this distance is calculated can be found in the paper.
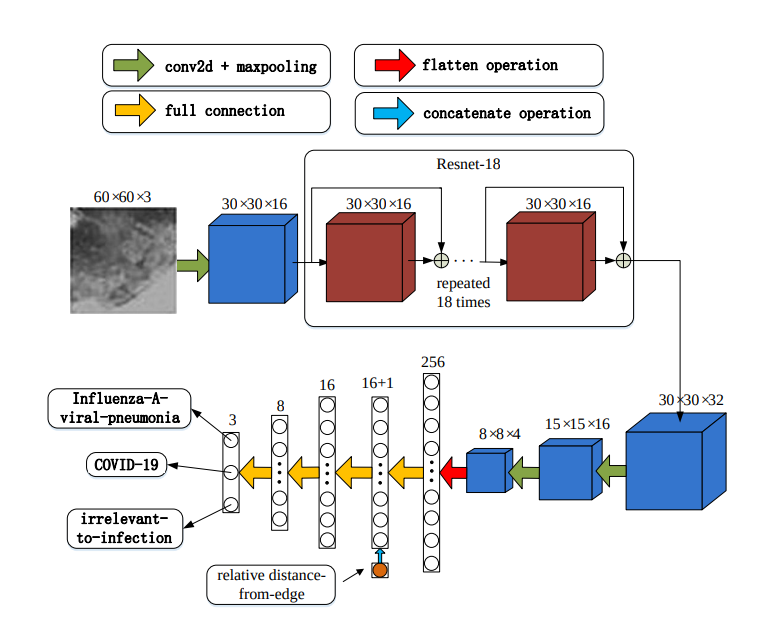
The network architecture is inspired by ResNet, with local-attention on the final classification layer.
Using 3-D Information
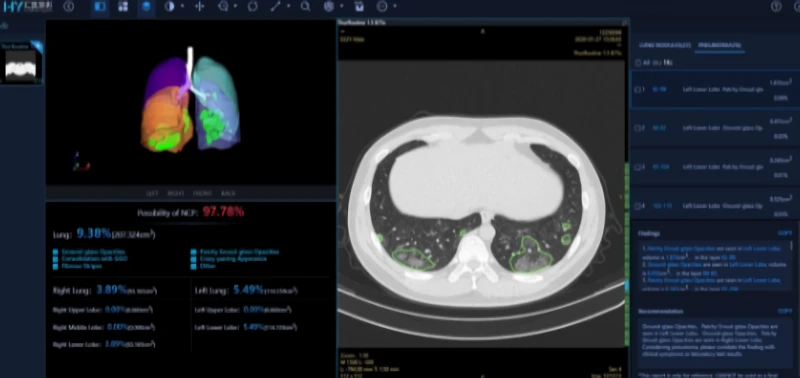
In yet another paper, titled Rapid AI Development Cycle for the Coronavirus (COVID-19) Pandemic: Initial Results for Automated Detection & Patient Monitoring using Deep Learning CT Image Analysis, the authors use a 3-D U-Net architecture to extract the lung out of the scan (same function as the VNET20 model).
Then these lung crops are classified by a neural network. The entire lung is passed to the classification network, unlike the previous work where ROIs were extracted from the lung before classification. The authors then use the Grad-CAM technique to create "heatmaps" of the lungs.
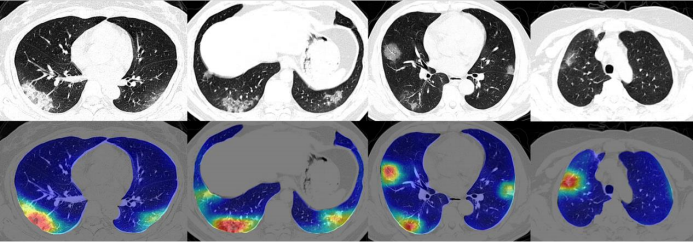
To classify each patient, multiple slices of the CT scan are used. Each of these scans are used to compute the class probabilities. The patient is classified as COVID-19 positive if a majority of the slices have COVID-19 as the highest class probability. (In other words, each slice counts as a vote).
In addition to classifying 2-D lung crops, the authors also use an off-the-shelf software, RADLogics, that detects nodules and small opacities within a 3-D lung volume. Then, the patches from the software and the heatmaps from the earlier stages are combined to create a 3-D visualization.
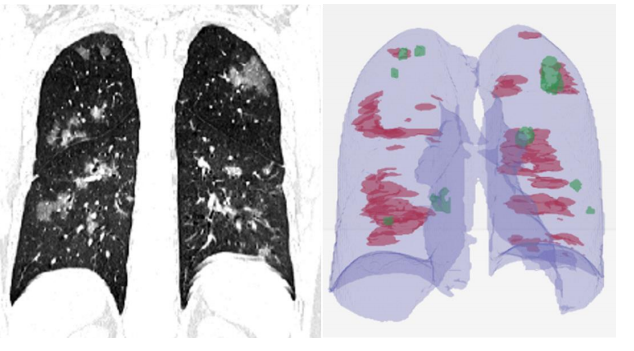
The volume of patches is then used to create a "Corona Score".
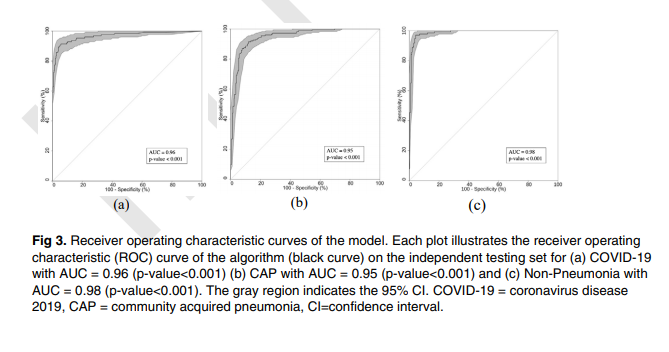
CovNet
In a very recent paper published by the Radiological Society of North America, Artificial Intelligence Distinguishes COVID-19 from Community Acquired Pneumonia on Chest CT, an architecture called CovNet was proposed to work on multiple 2-D slices of the same CT scan.
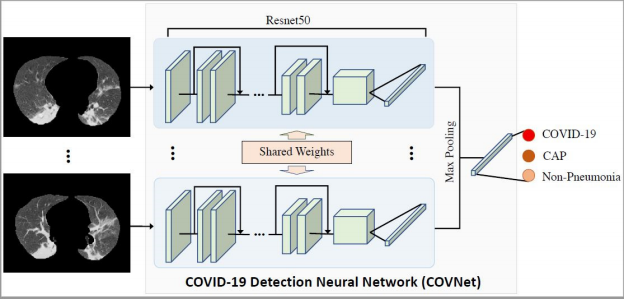
Feature vectors are derived from each slice. Then these multiple feature vectors are max-pooled to obtain a single feature vector. This feature vector is then fed to fully connected layers that classify a case as either COVID-19, Community Acquired Pneumonia, or Non-Pneumonia.
Evaluating Results
While evaluating the results of any coronavirus diagnosis method, the accuracy is not enough. This is because of all the people we test, only a few of them are going to have the virus. Hardly any country in the world has had a positive hit rate of more than 20 percent (positives cases out of all tests done). In such a case, let's say we develop a solution that just calls everything negative. From an accuracy point of view, the solution would still have 80 percent accuracy, despite being a totally useless classifier.
We therefore need to focus on other metrics, such as:
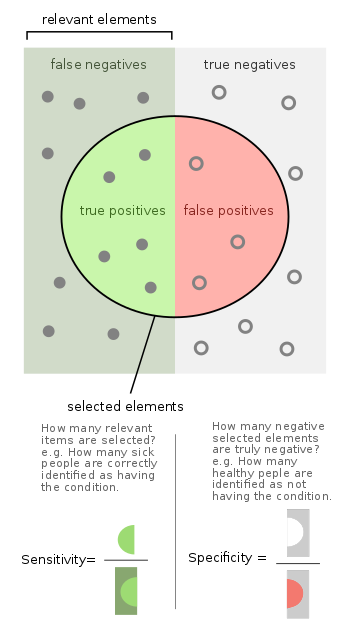
Sensitivity, or the true positive rate. This is the proportion of true positives out of the total number of positive samples, or simply put, the number of coronavirus infected patients that we correctly classify as positive. Having a sensitivity which is too low would mean that there are many people who have the virus which our algorithm classified as negative. This is a particularly alarming shortcoming to have, since it would allow many infected people to go home and perhaps spread the virus.
Specificity, or the true negative rate. This is the proportion of the true negatives to the total number of negative samples, or simply put, the number of non-infected people that we correctly classify as negative. Having a specificity which is too low would mean that we will be telling many people who don't have the virus that they do. While not as alarming as a low sensitivity, it could put undue pressure on health systems if we get too many false positives in our system.
People also use metrics like Precision (of all the patients we have diagnosed as positive, how many people actually had the disease; this is useful for measuring how resourceful our test is) and the F1 Score (which combines Precision and Sensitivity).
Area under ROC Curve is a measure of how well our classifier separates two classes. Typically all cases are given a probability by the classifier, and then we use a threshold to determine the outcome. We ideally want all the positive cases to score much higher than the threshold, and the negative cases to score much lower than the threshold. Why? Because if an example is closer to the threshold, it is difficult to be confident about the prediction.
For example, let's say we use a threshold of 0.5. Suppose a classifier assigns a case a probability of 0.9. We can confidently say that this case is a positive one. However, consider another case as 0.52. We can't say this example is positive with the same confidence. One could think, had the input varied a bit, we could have gotten a score of 0.48, and we would have called that same example negative.
AUROC is the graph between sensitivity and the false positive rate (1 - specificity). It can be computed only for binary classification cases, so when we have n classes, we have to make n "one class" vs "all other classes" AUC curves.
The area under the ROC curve can range from 0 to 1, where 1 represents the perfect classifier and 0.5 (meaning the curve follows the line y=x) represents a classifier which is as good as flipping a coin (random chance). An area under 0.5 means your classifier is even worse, and makes incorrect predictions more often than not.
In case you want to dig deeper into why AUROC works, here's a good resource for you:
 Sarang Narkhede
A Caveat Though...
Before ending this article, I'd like to point out some challenges which we face while applying deep learning tools to medical use cases.
As far as COVID-19 is concerned, in this post we basically covered how to detect the disease through CT scans. But truth be told, you can't really detect pneumonia through CT scans. This is because pneumonia is what we call a "clinical diagnosis". Radiologists don't merely look at CT scans and pronounce patients as having COVID-19. They may also look at blood work, clinical history, additional symptoms, etc. to arrive at a conclusion. This is because pneumonia caused by different reasons may or may not result in vastly distinct features in the CT scan. When a paper reports that a CT scan has better sensitivity than a RT-PCR, it actually means a method where doctors combine a CT Scan with other symptoms and features to diagnose a patient.
While this in no way demerits the usage of deep learning for diagnosis of COVID-19, one must be wary of flashy headlines such as this one when CheXNet came out.
Should radiologists be worried about their jobs? Breaking news: We can now diagnose pneumonia from chest X-rays better than radiologists. https://t.co/CjqbzSqwTx
— Andrew Ng (@AndrewYNg) November 15, 2017
No, radiologists are not going anywhere. But what these deep learning tools will do, however, is ease their work when there's a barrage of cases, as has happened with the coronavirus outbreak, and when time is of paramount importance.
Conclusion
That's all for this part folks. In the next part we'll be creating a classifier to identify lung X-Rays as COVID-19 or another infection. Currently there is no open source CT Scan dataset available for COVID-19, so we'll have to stick with X-Ray scans for now. (The data that was used in the papers we discussed above has not been made available in the public domain).